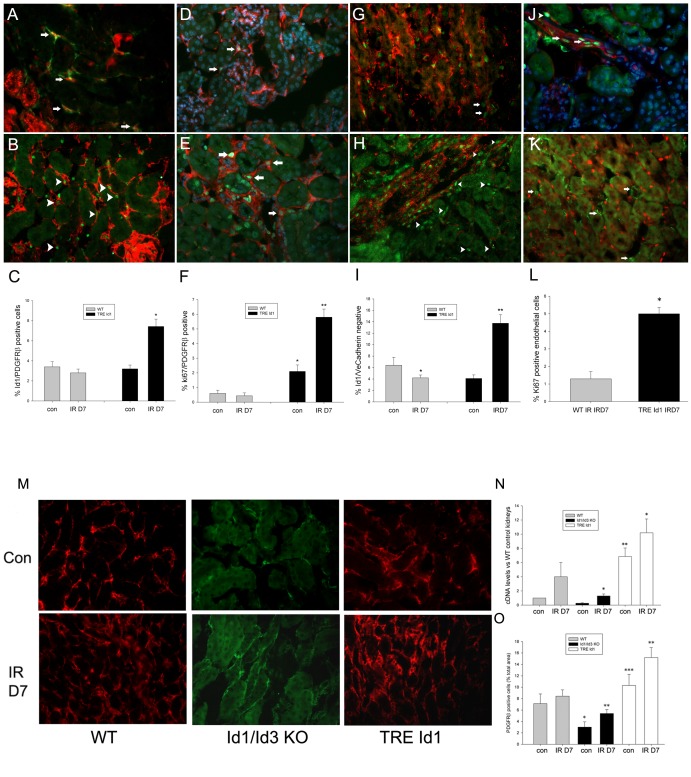
Figure 6. TRE Id1 mice have increased fibroblast Id1 expression and proliferation following ischemia-reperfusion injury.
Immunofluorescence images for indicated antigens of normal (Con) and 7 days post ischemia-reperfusion (IRD7) kidneys from WT, Id1+/+, Id3 RFP/+ and TRE Id1 mice as indicated and corresponding cell counts from 5 mice/group. Cells from 5 sections from each group were counted and results displayed as means +/− SEM. A) Id1+/+, Id3RFP/+ IRD7: green: PDGFRβ, red: Id3RFP, arrows: double positive cells, B) TRE Id1 IRD7: green: PDGFRβ, red: Id1, arrowheads: double positive cells, C) Id1 positive/PDGFRβ positive cell counts (%) in normal and IRD7 WT vs. TRE Id1 mice, *p = .001, D) WT IRD7: green: Ki67, red: PDGFRβ, arrows: double positive cells E) TRE Id1 IRD7: green: Ki67, red: PDGFRβ, arrows: double positive cells F) Ki67 positive/PDGFRβ positive cell counts (%) in normal and IRD7 WT vs. TRE Id1 mice, *p = .003, **p<.001, G) WT green:Id1, red: VE-cadherin, arrows: single Id1 positive cells, H) TRE Id1 control: green: Id1, red: VE-cadherin, arrowheads: single Id1 positive cells I) Id1 positive/VE-cadherin negative cell counts (%) in normal and IR D7 WT vs. TRE Id1 mice, *p = NS, **p<.001, J) TRE Id1 IRD7: green: Ki67 (arrows: arteriole, arrowhead: peritubular capillary), red: VE-cadherin, K) TRE Id1 IRD7: green: αSMA (arrows), red: Id1, L) Ki67 positive endothelial cell counts (%) in normal and IRD7 WT vs. TRE Id1 mice, *p = .01 (unpaired two-tailed t-test). M) Immunofluorescence labeling for PDGFRβ in control and day 7 IRI kidneys sections from indicated genotypes, A–M) Original magnification: 400X. N) Comparative PCR for PDGFRβ levels in control and day 7 IRI kidneys sections from indicated genotypes. *p<.05 vs con, **p<.01 vs WT con. O) Quantification of PDGFRβ positive cells as a percentage of total tissue area in control and day 7 IRI kidneys sections from indicated genotypes *p<.05 vs WT con, **p<.05 vs con, ***p<.01 vs WT con (one way ANOVA with Tukey HSD test).

