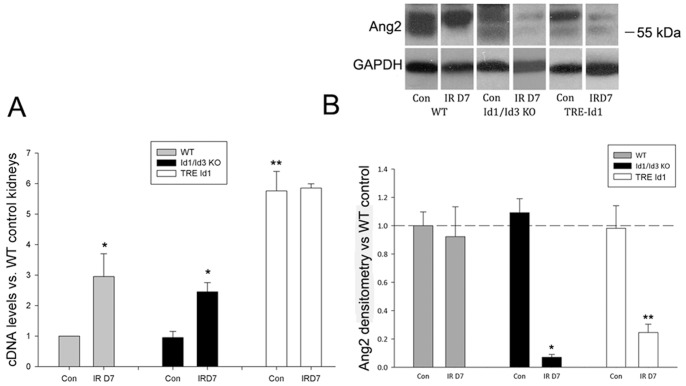
Figure 8. Angiopoietin 1 levels are increased in TRE Id1 mice and Angiopoietin 2 levels are decreased following IRI in knockout and transgenic mice.
A) Comparative PCR expressed as levels relative to WT control kidneys for Ang1 levels in control and day 7 post IRI kidneys of WT, Id1/Id3 KO, and TRE Id1 mice. *p<.05, **p<.01. B) Western blot of Ang2 levels in control and day 7 post IRI kidneys of WT, Id1/Id3 KO, and TRE Id1 mice. Results expressed as levels relative to WT control kidneys. *p<.001, **p<.05. (one way ANOVA with Tukey HSD test).

