
Figure 7.
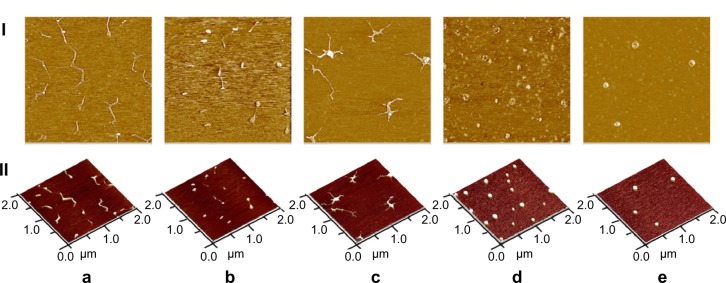
Atomic force microscopy images of (a) pDNA and the pDNA/DMAPA-Glyp-2.8 complex with different weight ratios: (b) w/w =0.3, (c) w/w =0.5, (d) w/w =2, and (e) w/w =20. I: Phase-mode images. Each image represents a 2×2 μm scan. II: Height-mode images.
Abbreviations: DMAPA 3-(dimethylamino)-1-propylamine; Glyp, glycogen; pDNA, plasmid deoxyribonucleic acid.