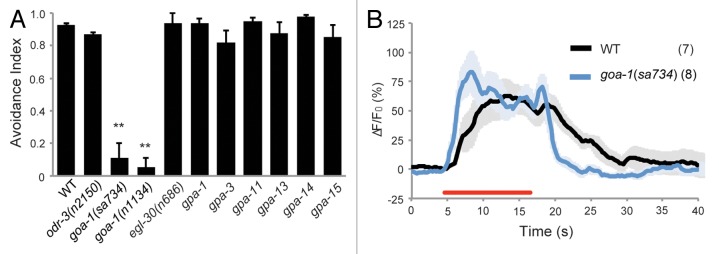
Figure 1. Behavior and imaging analyses of mutants deficient in a G protein α subunit. (A) Avoidance indices of wild-type and mutant animals. Assays were performed using petri dishes with 4 quadrants as described previously.13 Error bars indicate the SEM of 5 independent assays. **p < 0.01. (B) Ca2+ imaging of ASH in wild-type and goa-1 animals upon stimulation with pH 11.2. The red line represents the period of time during which animals were stimulated with pH 11.2 buffer. Numbers of recordings are shown in parentheses, and light color shading denotes the SEM.
