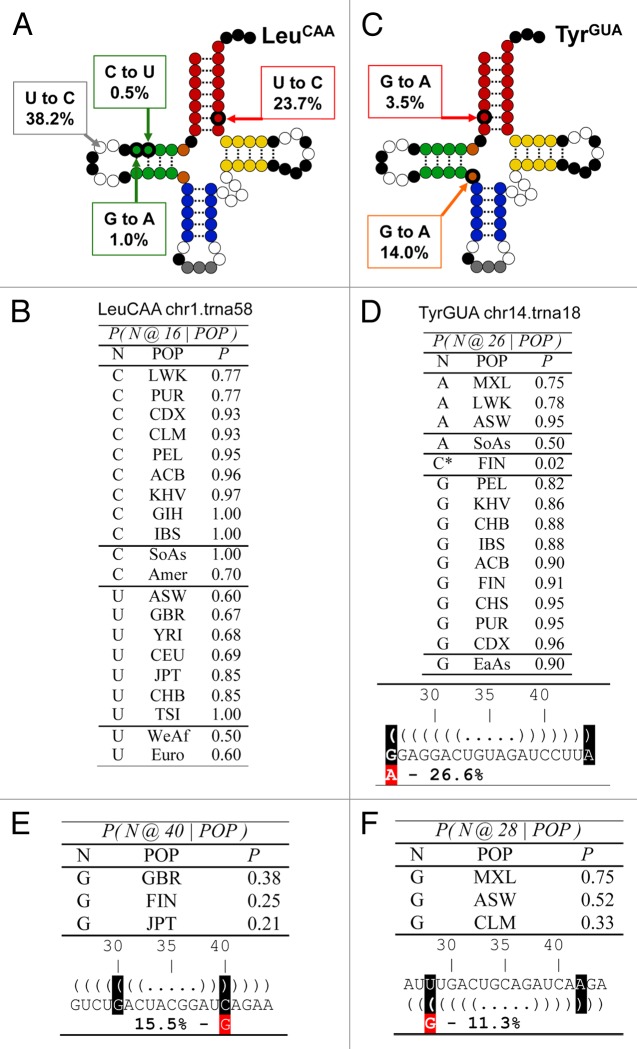
Figure 3. Population analysis of the most frequent new tRNA sequences among the high scoring tRNA group. (A) Sequence change mapped onto the canonical tRNA secondary structure for tRNALeu(CAA), the tRNA gene with the most abundant new instances. Square bubbles indicate the nucleotide substitution frequencies. Conserved nucleotides are shown in black, while the anticodon nucleotides in gray. Dotted lines show base paired positions. (B) Probability table conditioned on ancestry for position 16 of tRNALeu(CAA). The SoAs label stands for South Asian, Amer for Americas, WeAf for West Africa and Euro for European. (C) Sequence change mapped onto the canonical tRNA secondary structure for tRNATyr(GUA), the tRNA gene with the second most abundant new instances. (D) Probability table conditioned on ancestry for position 26 of tRNATyr(GUA). The SoAs label stands for South Asian, EaAs for East Asian. (E and F) Sequence changes in the anticodon stem in two other abundant new isodecoders. The sequence changes introduce a purine mismatch in the anticodon stem. (E) Position 40 of tRNAArg(ACG) occurring in 15.5% population. (F) Position 27 of tRNACys(GCA) occurring in 11.3% population.

An official website of the United States government
Here's how you know
Official websites use .gov
A
.gov website belongs to an official
government organization in the United States.
Secure .gov websites use HTTPS
A lock (
) or https:// means you've safely
connected to the .gov website. Share sensitive
information only on official, secure websites.
