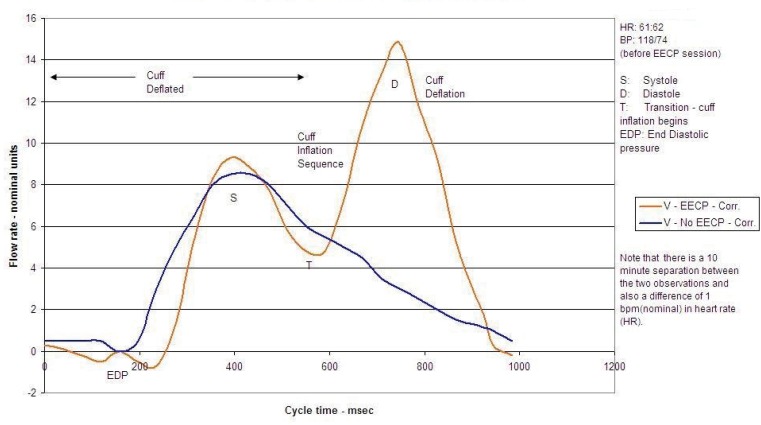
Figure 2.
Finger pleythysmogram showing the changes in vascular flow rate during EECP therapy; Blue curve indicates blood pressure without EECP; brown curve shows augmentation of blood flow as EECP cuff is inflated. [S: systole, D: diastole, T: transition (cuff inflation begins), EDP: end-diastolic pressure.]

