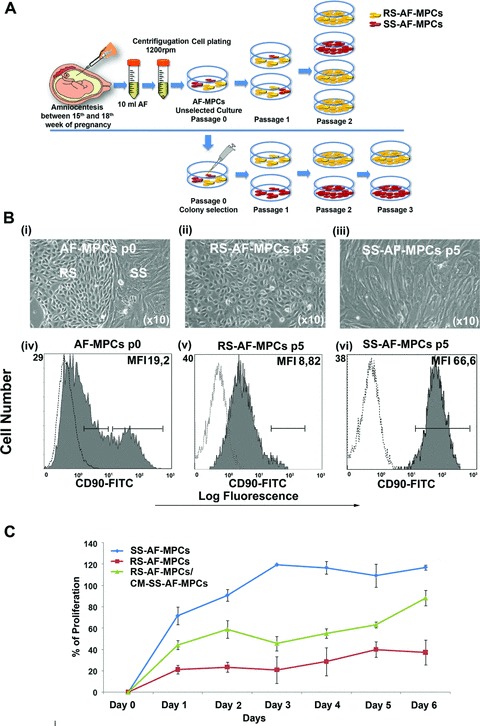
Fig 1.

Spindle- and round-shaped amniotic fluid mesenchymal progenitor cells. (A) Schematic representation of unselected AF-MPCs and mechanically selected colonies in an in vitro culture. (B) (i) AF-MPCs colonies morphology at p0, (ii) RS-AF-MPCs (p5) and (iii) SS-AF-MPCs (p5) morphology. Representative FACS histograms of (iv) AF-MPCs at p0, gated for CD90 expression (grey filled histograms), prior to analysis with the isotype-matched negative control (open histograms) at p0, (v) homogenous RS-AF-MPC at p5 and (vi) homogenous SS-AF-MPCs at p5 populations, respectively. (C) Comparative analysis of the percentage of proliferation of SS-AF-MPCs (blue line), RS-AF-MPCs (red line) and RS-AF-MPCs cultured in CM derived from SS-AF-MPCs (green line), during 6 days of culture by MTS assay. Values are mean ± S.D. for three independent samples from each MPC population.
