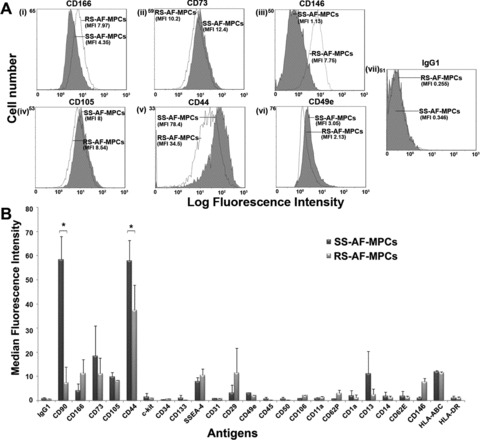
Fig 2.

Comparison of SS-AF-MPCs and RS-AF-MPCs expression patterns. (A) Representative FACS histograms of SS-AF-MPCs (grey filled histograms) and RS-AF-MPCs (opened histograms) gated for (i) CD166, (ii) CD73, (iii) CD146, (iv) CD105, (v) CD44 and (vi) CD49e markers, prior to analysis with (vii) the isotype-matched negative control. (B) SS- and RS-AF-MPCs analysed for different antigens expression by FACS analysis. The statistics were made on the mean MFI for each antigen. Isotype matched negative controls were used. Values are shown as mean ± S.D. for three independent samples from each type. Statistical analysis was performed using the Student’s t-test (*P < 0.05).
