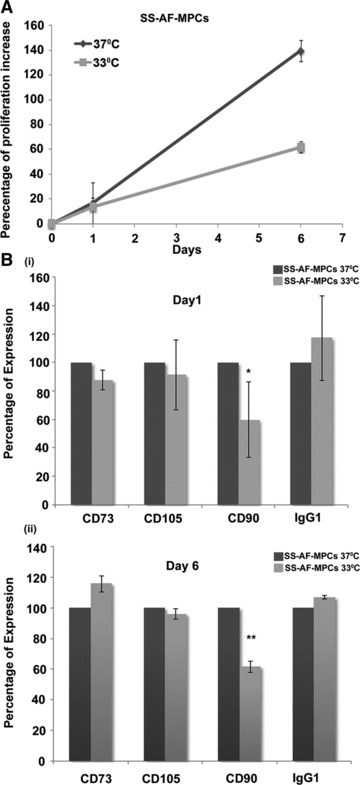
Fig 3.

CD90 expression alteration according to the proliferation rate of SS-AF-MPCs. (A) Comparative analysis of the percentage of proliferation increase of SS-AF-MPCs at 37°C (grey line) and 33°C (light grey line), respectively during 6 days of culture. (B) Comparison of the percentage of expression of CD73, CD105 and CD90 (i) at day 1 and (ii) day 6 of culture at 37°C (grey bars) and 33°C (light grey bars) by FACS analysis, respectively. MFI values were normalized for each marker against the level of expression determined at 37°C, which was set to 100%. Values are shown as mean ± S.D. for three independent experiments. Statistical analysis was performed using the Student’s t-test (*P < 0.05; **P < 0.001).
