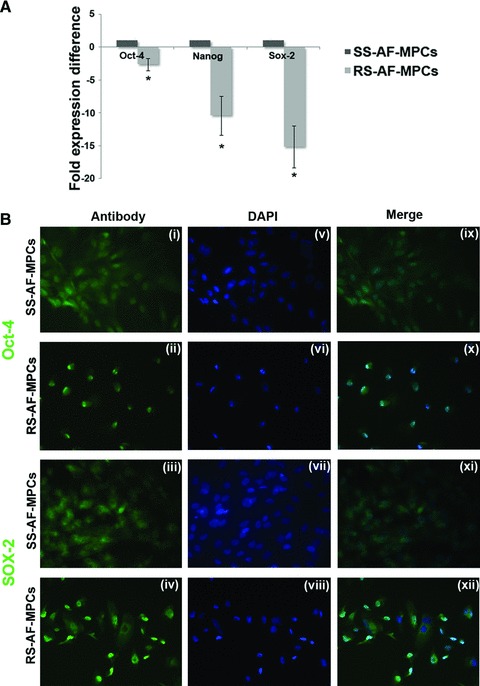
Fig 5.

Embryonic stem cell marker expression and differentiation potential of SS-AF-MPCs and RS-AF-MPCs. (A) Comparative analysis for the expression of oct-4, nanog and sox-2 in three SS-AF-MPCs and RS-AF-MPCs samples, respectively, analysed by RT-PCR. Results were first normalized to human GAPDH positive control and then to SS-AF-MPCs expression levels for each marker, respectively. Statistical analysis was performed using the Student’s t-test. (B) Immunofluorecent nuclear staining for (i–ii) Oct-4, (iii–iv) Sox-2 and (v–viii) DAPI (ix–xii) of SS-AF-MPCs and RS-AF-MPCs. Merge of DAPI staining and antibody staining. Original magnifications, 40×.
