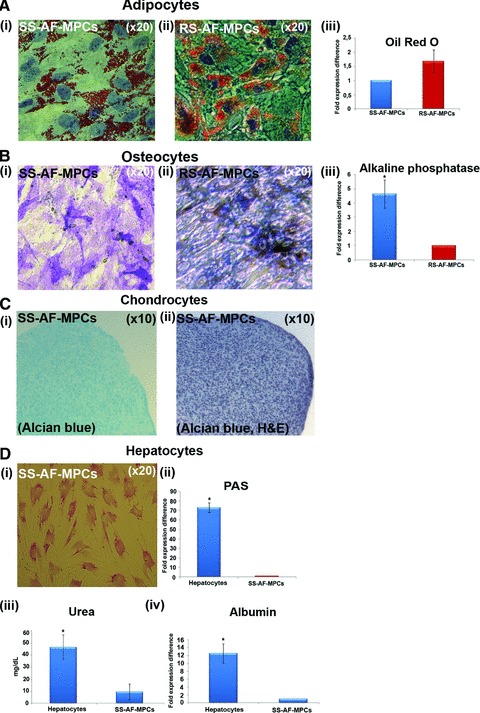
Fig 6.

(A) Oil Red O staining for adipocyte differentiation properties of (i) SS-AF-MPCs and (ii) RS-AF-MPCs respectively, followed by (iii) quantitation analysis. (B) Alkaline phosphatase staining for osteocyte differentiation for (i) SS-AF-MPCs and (ii) RS-AF-MPCs respectively, followed by (iii) quantitation analysis. (C) (i) Alcian Blue and (ii) haematoxylin and eosin staining of SS-AF-MPCs, cultured under chondrogenic inducing conditions in pellet mass cultures. (D) PAS staining for hepatocyte differentiation for (i) SS-AF-MPCs induced to hepatocytes. (ii) Quantitation analysis for PAS staining, (iii) determination of the secreted Urea and (iv) albumin expression were shown. Quantitation of the respective differentiation assays was performed by using the Image J analysis software on 10 fields per image. For each sample, four images were taken. For adipogenic and osteogenic differentiation values were normalized in each case against the AF-MPC type with the lower differentiation capacity, which was set to 1, whereas for hepatogenic differentiation, values were normalized in each case against non-induced to differentiation SS-AF-MPCs. Values are mean ± S.D. from three samples from each type. Statistical analysis was performed using the Student’s t-test, *P < 0.05.
