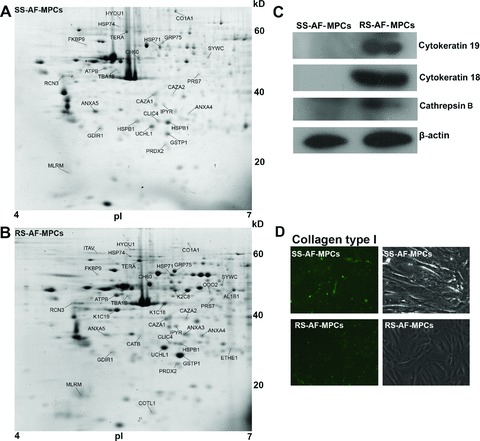
Fig 7.

Two-dimensional gel electrophoretic analysis of AF-MPCs. (A) Representative 2D-gel electrophoresis image of proteins extracted from SS-AF-MPCs and (B) RS-AF-MPCs. The differentially and unique expressed protein spots in each population are indicated with their abbreviated names and listed in Tables S1–3, respectively. (C) Confirmation of the cytoskeratin 19 and 18 and cathepsin B expression by Western blot analysis with the respective antibodies in cell extracts from SS-AF-MPCs (lanes 1) and RS-AF-MPCs (lanes 2). Protein bands of 40, 54 and 38 kD corresponding to cytoskeratin 19 and 18 and cathepsin B heavy chain were detected. Immunoblotting for b-actin has been conducted to ensure the comparable loading of proteins in each lane. (D) Confirmation of the higher expression of collagen α1 (I) protein in SS-AF-MPCs compared to RS-AF-MPCs by immunofluorescent staining.
