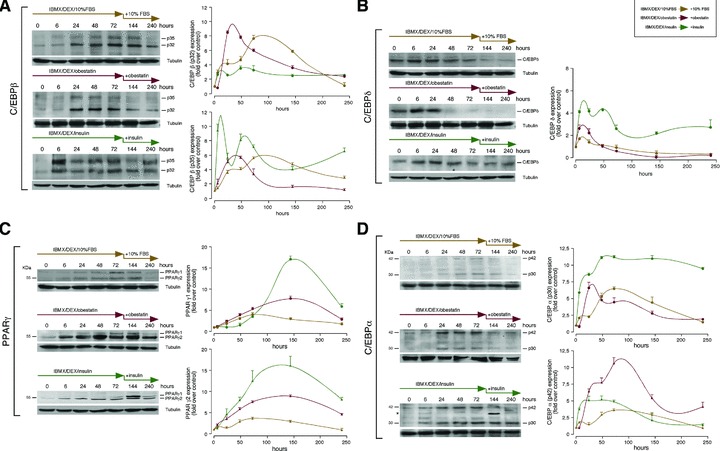
Fig 4.

Immunoblots showing the expression pattern of: (A) C/EBPβ, (B) C/EBPδ, (C) PPARγ and (D) C/EBPα. 3T3-L1 pre-adipocyte cells were maintained in DMEM containing 10% FBS, obestatin (392 nM) or insulin (172 nM) for 7 days after induction of differentiation by treatment with 0.5 mM IBMX, 25 μM DEX, 10% FBS, 861 nM insulin or 1.96 μM obestatin for 3 days [in (D), asterisk (*) denotes unspecific band]. Data were expressed as percentage of control expression (n = 3; mean±S.E.). Blots are representative of three independent experiments.
