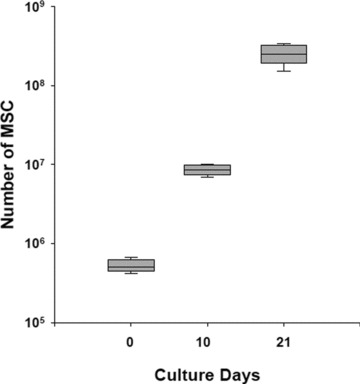
Fig 2.

Expansion potential of MSC derived from selected BM-CD105+cells. Growth profile of CD105+ cells sorted on day 0 and plated at 2 × 10³ cells/cm2 culture surface. On day 10, adherent cells were detached with thrypsin and replated at 4 × 10³ cells/cm2 in culture for an additional period of 11 days. Boxes represent the interquartile range; lines inside boxes represent the median value; whiskers represent the lowest and highest observations, respectively.
