Fig. 4.
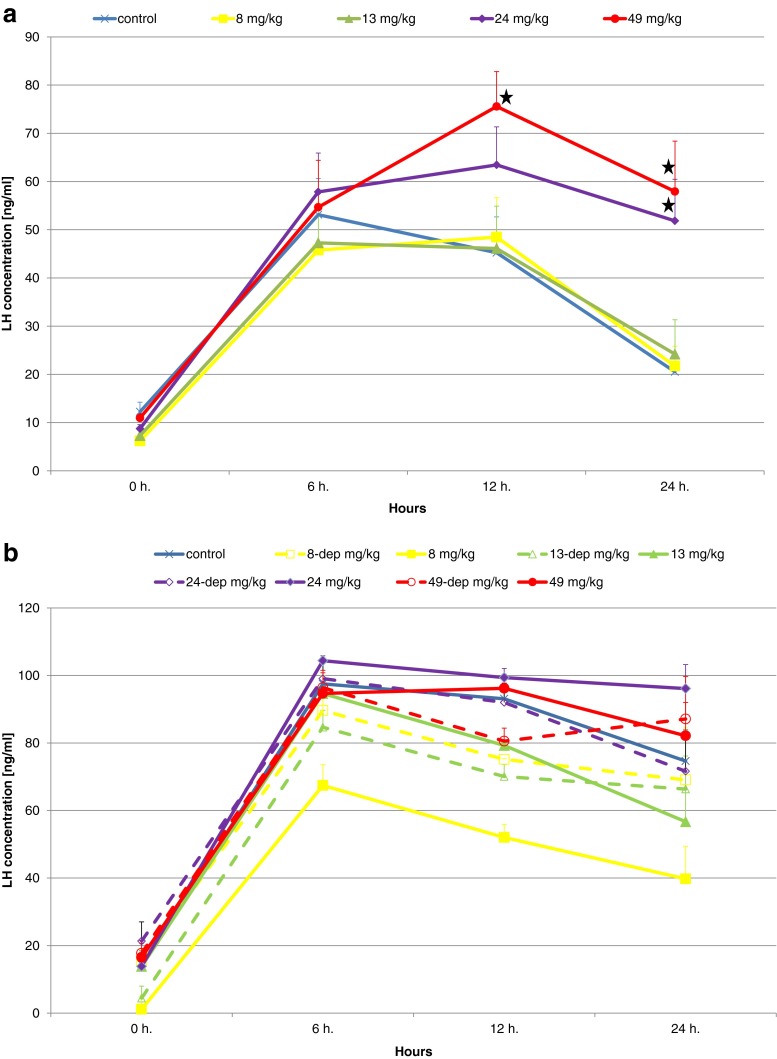
Comparison of plasma LH concentrations in successive blood collections following the ovulation-stimulating injection after 12 (a) and 24 (b) months of female Prussian carp exposure to different doses of lead (groups 8, 13, 24, and 49 mg Pb kg−1) and in females after 12 months of exposure and 12 months of depuration (groups 8-dep, 13-dep, 24-dep, and 49-dep) (b). Concentrations significantly different to control (p < 0.01) are marked with a star. No differences between groups after the 24-month exposure period as well as after the 12-month exposure and 12-month depuration periods. Error bars represent standard errors

