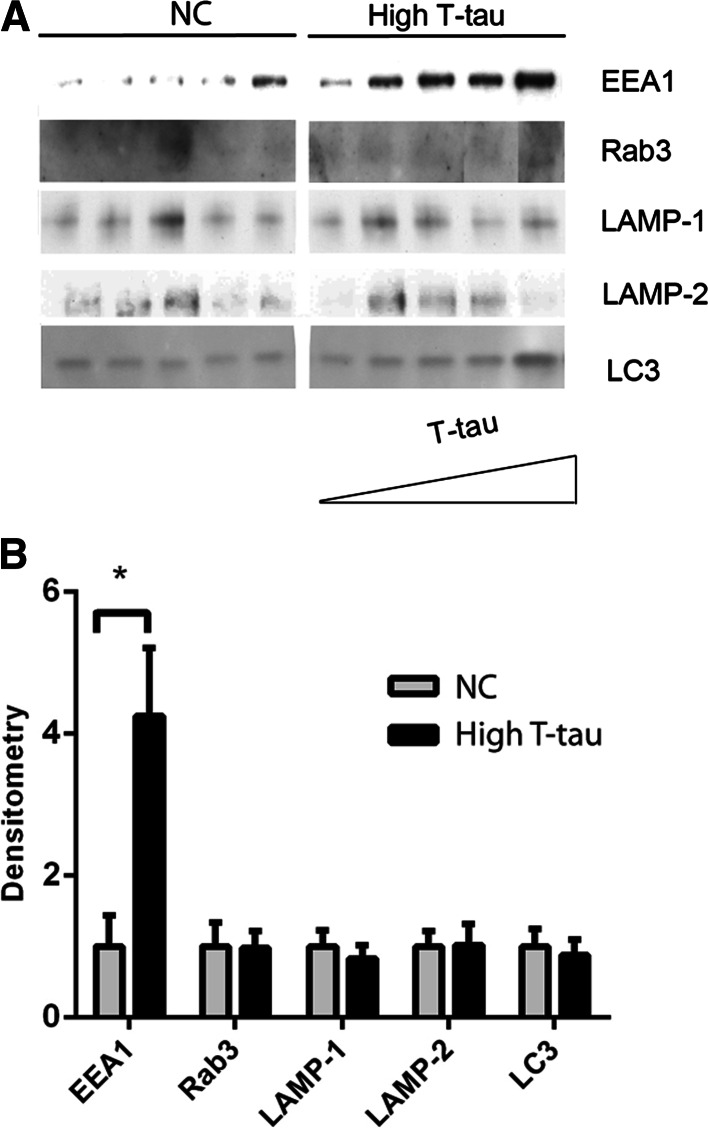
Fig. 5.
EEA1 levels are enhanced as T-tau levels increase. Five NC samples and five samples with high-T-tau levels (high T-tau) (Table 1, CSF set 3) were analyzed by Western blot. a Western blots of EEA1, Rab3, LAMP-1, LAMP-2 and LC3 levels. b Densitometric quantification of the scanned Western blots from a. The protein levels are normalized to the respective means of the NC samples. The bars represent the mean ±SD, *p < 0.05

