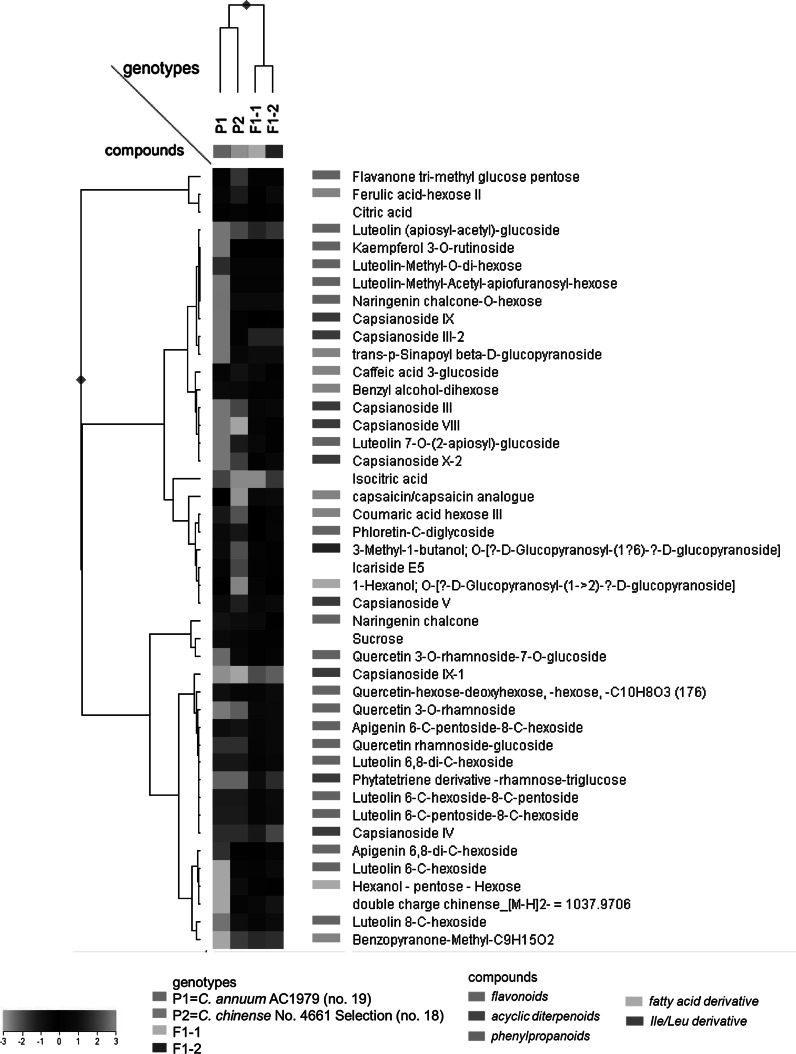
Fig. 2.
Heat map of 43 putative semi-polar metabolites which accumulated in ripe fruits of the parental accessions, C. annuum AC1979 (no. 19) and C. chinense No. 4661 Selection (no. 18), and/or the two F1 plants. A color-coded matrix represents values of the metabolite intensity in each genotype, which has been log2-transformed and mean-centered. (Color figure online)

