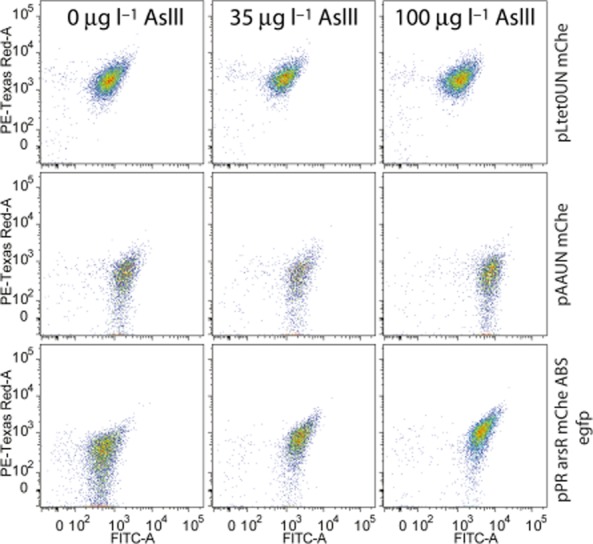
Figure 6.

FC analysis of single-cell heterogeneity of ArsR–mCherry and EGFP expression in E. coli MG1655 ΔRBC coupled and uncoupled bioreporters after 3 h exposure to arsenite at the indicated concentrations. Dot plots show EGFP (FITC-A channel) versus mCherry fluorescence (PE-Texas Red-A channel) of single cells on a 10log-scale for ∼ 2000 events per sample.
