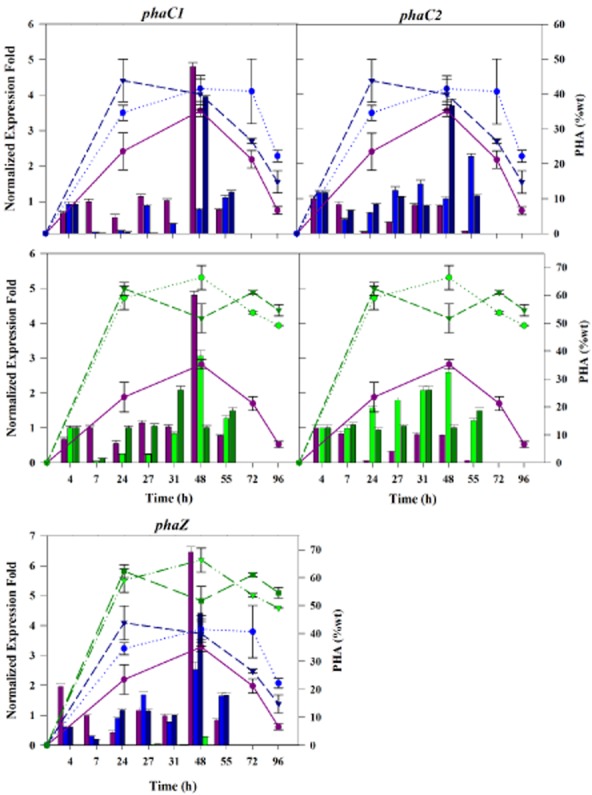
Figure 3.

Expression of pha genes and PHA accumulation in P. putida U. Each panel shows normalized fold-increased in expression of the pha genes in PpU (violet), PpU 10–33 non induced (light blue) and PpU 10–33 induced (dark blue), PpU10-33-ΔphaZ uninduced (light green) and PpU10-33-ΔphaZ induced cells (dark green). The relative expression ratio of the target genes was calculated automatically with the CFX software using the standard error of the mean and the normalized expression method [ΔΔ(Ct)]. PHA content (% CDW) is showed with lines, using the same strain colour designation mentioned above. Experimental triplicates and independent biological duplicates were used for the calculations.
