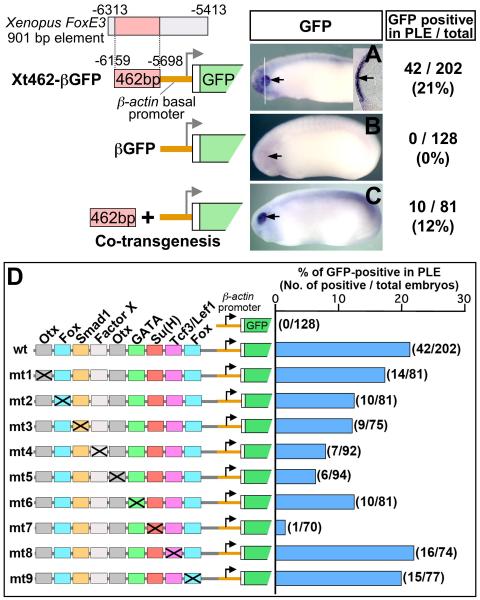
Fig. 3.
Mapping of regulatory motifs essential for PLE-specific activity of the FoxE3 enhancer. (A–C) Representative transgenic embryos (stages 22–24) generated with GFP reporter constructs shown on the left. Black arrows indicate the PLE. Numbers of embryos with GFP expression in the PLE and the total number of normally (or near normally) developing embryos injected with each construct are indicated on the right side with percentages of the GFP-positive cases. A white line in (A) indicates the plane of a transverse section shown as an inset. A black arrow in the inset indicates GFP expression in the PLE overlying the optic vesicle. The embryo shown in (C) was generated by co transgenesis, i.e. co-injection of the 462 bp enhancer of Xenopus FoxE3 amplified by PCR along with the βGFP cassette. (D) Identification of transcription factor-binding motifs essential for PLE-specific expression by mutation analysis. wt is the construct used in Fig. 3A (Xt462-βGFP). mt1-mt9 were generated from wt/Xt462-βGFP by introducing a base-substitution mutation (marked with a cross) into each of the conserved transcription factor-binding motifs. The right graph shows percentages of embryos with GFP expression in the PLE in total developed embryos injected with the constructs shown in the left side. Actual numbers of GFP-positive cases and that of total embryos are indicated in parenthesis.

