Abstract
We report the synthesis, structural characterization, and atomistic simulations of AgPd/Pt trimetallic (TM) nanoparticles. Two types of structure were synthesized using a relatively facile chemical method: multiply twinned core-shell, and hollow particles. The nanoparticles were small in size, with an average diameter of 11 nm and a narrow distribution, and their characterization by aberration corrected scanning transmission electron microscopy allowed us to probe the structure of the particles at atomistic level. In some nanoparticles, the formation of a hollow structure was also observed, that facilitates the alloying of Ag and Pt in the shell region and the segregation of Ag atoms in the surface, affecting the catalytic activity and stability. We also investigated the growth mechanism of the nanoparticles using grand canonical Monte Carlo simulations, and we have found that Pt regions grow at overpotentials on the AgPd nanoalloys, forming 3D islands at the early stages of the deposition process. We found very good agreement between the simulated structures and those observed experimentally.
Keywords: AgPd/Pt core-shell, trimetallic nanoparticles, hollow structure, multiply twinned particles, Monte Carlo simulation, Cs-corrected STEM, EDX
1. Introduction
It is well established that the synergistic combination of different metals in bimetallic (BM) and Trimetallic (TM) nanoparticles (NPs) significantly change the catalytic properties of the metal. 1–5 The study of multi-metallic NPs has become an important topic in catalysis; in particular, Pt- and Pd-based NPs are extremely significant due to their higher activity in various catalytic reactions related to fuel cells 6–11 and others. 12–15 However, the limited natural abundance and high cost of the precious metals (Pt, Pd) is one of the big challenges that emerge for their use in practical applications. Therefore, an important objective is to synthesize NPs in such a way that most of the catalytically active atoms will be on the surface, maximizing the efficiency in their use, which is predominantly favorable for the amount of the precious metal. For practical purposes, the mass specific activity (MSA) of precious metal NPs must be maximized. One way to increase MSA is through the synthesis of NPs with relatively smaller sizes. However, in the case of larger particles, a possible way to increase MSA is through the synthesis of nanoparticles with high index facet (HIF) surfaces 16 and the subsequent decoration of the particles with precious metals (Pt) on their surfaces. Several groups have been exploring different ways to reduce the usage of Pt and other precious metals as catalysts increasing the MSA. 17–19
Among the several possibilities of Ag, Pt and Pd-based core-shell and alloys, the bifunctional effect in PdPt, has shown promising performance in several industrial reactions. 9, 14, 20–24 Similarly, Ag-based Pt and Pd nanostructures had generated significant attention, since inter-metallic precious metal electro-catalysts with a cheap transition metal such as Ag at the core of the particles exhibit enhanced electrocatalytic performance for various fuel cell applications. 23, 25 Peng et al. 26 reported the formation of various morphologies of Pt-Ag hollow nanoparticles, each nanoparticle consisting on a large void space and porous walls that give the structure a high surface area. The shape effect enhances the catalytic activity for methanol oxidation reactions (MOR) and for oxygen reduction reactions (ORR). Furthermore, in recent years various studies have been directed toward the formation of TM NPs, which exhibit a considerable improvement on the tuning of the catalytic performance, compared against bimetallic and monometallic particles of similar size. 27–29 It has been already reported that the sequential electronic effect of different atoms present in the TM system enhances the overall electronic charge shift and increases the catalytic activity. 29 However, while there have been a few reports on noble TM NPs in the literature so far, including Au@Pd@Pt, AuPtRh, AuAgPd, Au/Pt/Ag,1, 30–32 and a detailed structural analysis has been rarely reported. Yang et al.24 reported the synthesis of monodispersed 15 nm-sized, multiply twinned AgPd@Pt NPs, that exhibit a superior catalytic activity towards ORR. However, the size of the particles is relatively large, and the study does not include any theoretical work aimed at understanding neither the structural features nor the growth sequence of the Pt-shell on the surface. Thus, a study that combines the synthesis of smaller structures (improving MSA) and a detailed experimental characterization combined with theoretical results that explain adequately the Pt-shell growth sequence on the surface at atomistic resolution will be an important progression in the understanding of AgPd/Pt TM NPs.
The energetic, structures and segregation (chemical ordering) of AgPd binary alloys have been explored previously by means of computer simulations. For instance, global optimizations performed over small clusters (up to 38 atoms) for AgPd, reveals a tendency to surface segregation of Ag, Rossi et al. 33 Using an improved empirical potential Negreiros et al. 34, 35 have reported that for AgPd clusters with N=100, the lowest-energy homotops are always characterized by a palladium core covered by a silver rich surface with isolated Pd atoms in high-coordination sites on (111) surfaces. For the case of small AgPt and PdPt nanoalloys (with N =38 atoms), global optimizations using the Gupta potential in combination with DFT reveals in all cases that Pt atoms occupy the inner core due to a combined effect between surface energy and the differences in electronegativities. 36–38 However, it should be noted that in all cases the lowest energy structures were obtained from gas-phase (isolated atoms) and ligands or any environment was not considered.
In this study, we report the synthesis of narrowly sized AgPd/Pt trimetallic nanoparticles of approximately 11 nm in diameter, and their characterization using aberration-corrected STEM techniques. The high-resolution HAADF-STEM images, intensity profiles, and energy dispersive X-ray spectroscopy (EDS) line scans, allowed us to study the atomic positions of Ag, Pd, and Pt, finding that the Pt atoms are partially distributed on the surface. Additionally, we observed a tendency of Ag atoms to migrate towards the surface, which frequently results in the formation of hollow, cage like structures. We used computer simulations to study the main mechanisms of Pt deposition on AgPd nanoalloys; in particular, we studied the growth sequence of AgPd/Pt trimetallic nanoparticles using Grand Canonical Monte Carlo (GCMC) simulations, where the chemical potential of the Pt atoms can be controlled during nucleation. Both the empirical investigation and the theoretical analysis give strong evidence that these nanoparticles are composed by an AgPd alloy core and Pt atoms on the surface.
2. Experimental
2.2 Chemicals and Materials
Silver nitrate (AgNO3, 99.9%), potassium tetrachloropalladate (II) (K2PdCl4, 98%), chloroplatinic acid hydrate (H2PtCl6 .xH2O, 99.9%), oleylamine (technical grade, 70%), sodium oleate, oleic acid, ethylene glycol (EG), methanol (98%), Hexane, and toluene (99%), all chemicals from Aldrich and Sigma-Aldrich, were used in the experimental processes. All the chemicals were of analytical grade, and were used without further purification.
2.2 Synthesis of AgPd Alloyed Nanoparticles
In a first stage, AgPd alloyed nanoparticles were synthesized at high temperature (250 °C) in oleylamine solution.24, 39, 40 Oleylamine herein acts as solvent, reducing agent and stabilizer for the formation of nanocrystals. A solution of 10 mL of 0.026 M AgNO3 was heated at 160 °C under an Argon atmosphere and the mixture was stirred for an hour. From this process, Ag nanoparticles were formed. The Ag nanoparticles were used as seeds for the formation of the Alloy/Core-Shell nanoparticles. Subsequently, the solution of 1 mL of 0.092 M K2PdCl4 was immediately added to the Ag seed solution, and the mixture was kept at 250 °C for 1 h under an Ar atmosphere under magnetic stirring, forming a dark brown color solution. The resulting solution was let to cool down to room temperature.
2.3 AgPd/Pt Core-Shell Trimetallic Nanoparticles
In a second stage, a mixture containing deionized water (6 mL), ethylene glycol (4 mL), oleic acid (0.4 mL) and sodium oleate (0.03 g) was vigorously stirred for 10 min at room temperature. 50 μL of the AgPd colloidal solution prepared in the previous stage were added to the mixture and the stirring continued for 30 minutes. 0.008 M of 500 μL H2PtCl6 .xH2O was added drop by drop by using a syringe pump and the mixture was vigorously stirred. Subsequently, 1 mL of 0.1 M ascorbic acid (AA) was added dropwise and the mixture was left undisturbed at room temperature with magnetic stirring for 24 hrs. The solution containing trimetallic nanoparticles already was precipitated by using ethanol and hexane at a 70/30 proportion, and centrifuged three times at 3000 rpm for 10 min. each time, which removes the free ligands. The precipitate was then re-dispersed in toluene. The schematic representation of the synthesis procedure is shown in Scheme. 1. The resulting particles were drop-casted onto 3 mm copper grids for their subsequent characterization.
Scheme 1.
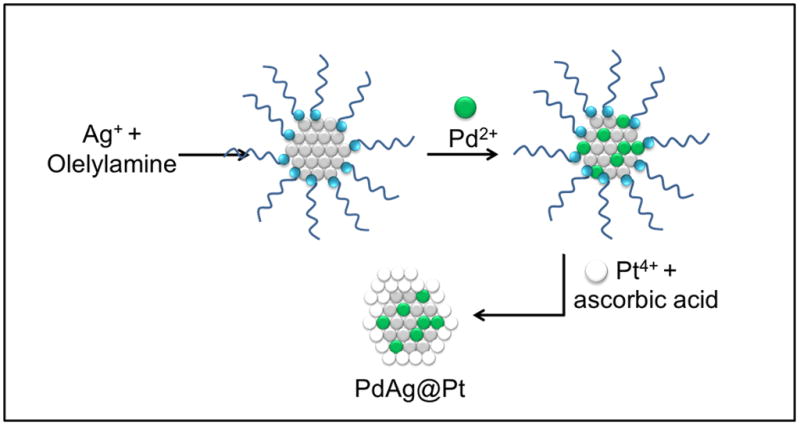
Schematic representation of synthesis of AgPd@Pt trimetallic nanoparticles.
2.4 Electron Microscopy Characterization
The morphology of the nanoparticles was characterized by high angle annular dark field (HAADF) scanning transmission electron microscopy (STEM) The HAADF-STEM images were recorded in with a Cs-corrected JEOL JEM-ARM 200F microscope operated at 200 kV, using a convergence angle of 26 mrad and collection semi-angles from 50 to 180 mrad. These variations in semi-angles satisfy the conditions set forth for the detectors to eliminate contributions from unscattered and low-angle scattered electron beams. The probe size used was about 0.09 nm with the probe current of 22 pA. In addition, bright field (BF) STEM images were recorded by using a collection semi-angle of 11 mrad. Electron dispersive x-ray spectroscopy (EDS) spectra were obtained using a probe size of 0.13 nm with the probe current 86 pA.
3. Computer Simulations
To simulate nanoparticle growth, the ideal ensemble is the grand canonical, where the volume (V), temperature (T), and the chemical potential (μ) of the atoms being deposited are held fixed. This is achieved by means of trial insertion and deletion of atoms. Thus, we have performed extensive grand canonical (GC) simulations using the Metropolis Monte Carlo procedure to sample the configurational space, using in all cases 105 MC steps to reach equilibrium configurations. The importance sampling scheme in our GC-MC procedure has been described in detail in ref.41, 42 We used the Foiles-Daw-Baskes version of the embedded atom method to model the interatomic interactions between the various atom types.43 In order to improve the sampling of the insertion/deletion trial moves, the whole volume of the simulation box was replaced by a very large number of small spheres, with an accessible volume (Vacc) defined as : where ns represent the total number of spheres of radius rs where atoms can be added/deleted in order to satisfy detailed balance. We have explored the deposition of platinum atoms on AgPd alloyed seeds with both, icosahedral and decahedral shapes in order to compare directly with the experimental evidence. Although we have not considered the activation barriers during adatom deposition and diffusion, due to the impossibility to simulate “real” time in MC calculations, a general picture, in particular from thermodynamics view point emerges. Even more, due that our implementation of the MC method works in an off-lattice fashion, most of the vibration and diffusion mechanisms are captured.
4. Results and Discussion
Fig. 1(a) shows a typical TEM (and HRTEM in the inset) micrograph of as prepared AgPd bimetallic nanoparticles, synthesized by using a simple one-pot method. These multiple twinned structure nanoparticles were uniform in size, with an average diameter of 9 ± 1.0 nm, as shown in the histogram of Fig. 1(b). The AgPd alloy was formed by the rapid interdiffusion of the metal atoms and the replacement reaction between Ag atoms and Pd(II) species, which is similar to the formation of AgAu or AgPd alloy nanoparticles by the replacement reactions between Ag atoms and Au or Pd metal ions in an aqueous solution.44, 45 These AgPd nanoparticles were used as seeds for the formation of the AgPd/Pt ternary nanocrystals with core-shell and alloyed structure.
Fig. 1.
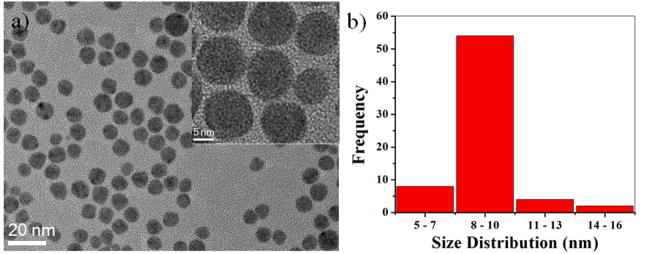
(a) Low magnification TEM and inset shows the HRTEM images of the AgPd icosahedral alloyed nanoparticles. (b) Histogram shows the average size of the nanoparticles were 10 nm.
We performed a set of numerical calculations using density functional theory (DFT), in order to understand the effect of the surfactant (RNH2 – R=C18H35) on the structure and composition of AgPd nanoalloys. The calculated adsorption energy of alkylamines (NH2R, R=CH3) at a coverage degree of 0.11 ML on Pd(111) surfaces was found to be −0.66 eV, whereas the adsorption energy of methylamine on Ag(111) surface is −0.43 eV (see Supplementary Information (SI) for more details Fig. S5). These results reveal that the interactions between the surfactant molecules with Pd and Ag are similar in energy, slightly favorable for Pd-NH2R. Therefore, considering that Ag seeds were formed previous to the addition of the palladium salt, it can be presumed that Pd atoms will be deposited on the surface of the Ag seeds. However, it must be noted that Ag has smaller surface energy than Pd ( , against ),46 and thus it is expected to segregate to the surface so that total energy of the whole system is minimized. Therefore, considering both contributions mentioned above, one can expect a certain degree of mixing between Ag and Pd leading to AgPd alloys.
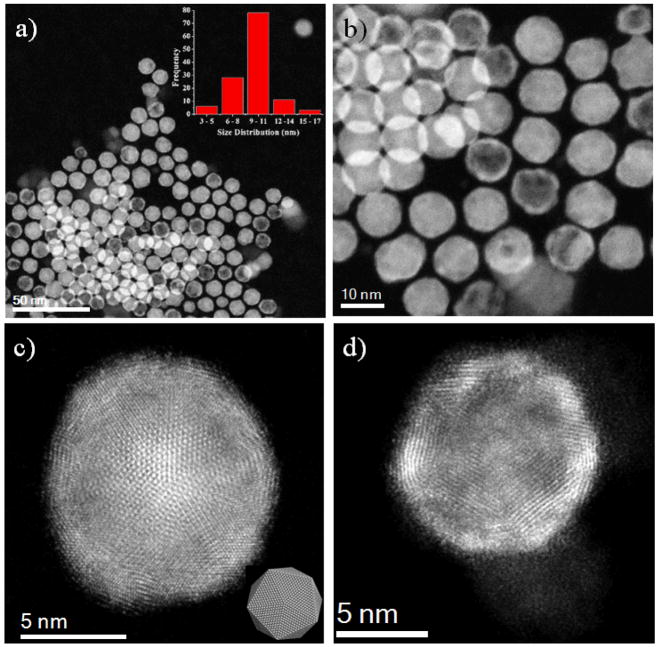
Fig. 2(a) show low magnification of HAADF-STEM images of representative AgPd/Pt icosahedral core-shell nanoparticles obtained using this simple synthesis method. The nanoparticles were uniform, with a typical edge length of 10 ± 1.0 nm, as can be noted from the size distribution histogram (inset Fig. 2(a)). Fig. 2(b) corresponds to an amplified HAADF image of AgPd/Pt core-shell multiply twinned particles with icosahedral morphology. The icosahedra, each formed by 20 tetrahedra, were found to be distributed on the sample with no preferential orientations (see SI Fig. S1). Fig. 2(c) shows a high magnification HAADF image of an icosahedral structure oriented on its 5-fold symmetry axis, and the inset represents an atomistic model with the same orientation.47 Using Z-contrast imaging, we can trace the distribution of the atomic sites for Ag, Pd and Pt, and we found that Pt atoms were mainly concentrated in the outer surface. Interestingly, we also observed that some of the icosahedral nanoparticles were hollow, cage-like structures, as can be noted on the magnified HAADF-STEM images shown in Fig. 2(d); these structures are described also in Fig. 5.
Fig. 2.
(a) Low magnification and (b) Amplified HAADF-STEM images of AgPd/Pt core-shell multiply twinned particles with icosahedral morphologies. High magnification of HAADF images (c) Icosahedral structure along 5-fold symmetry axis inset shows the atomistic model of the 5-fold symmetry axis and (d) Hollow structure nanoparticle, where we observed the Ag atoms are segregated from the structure.
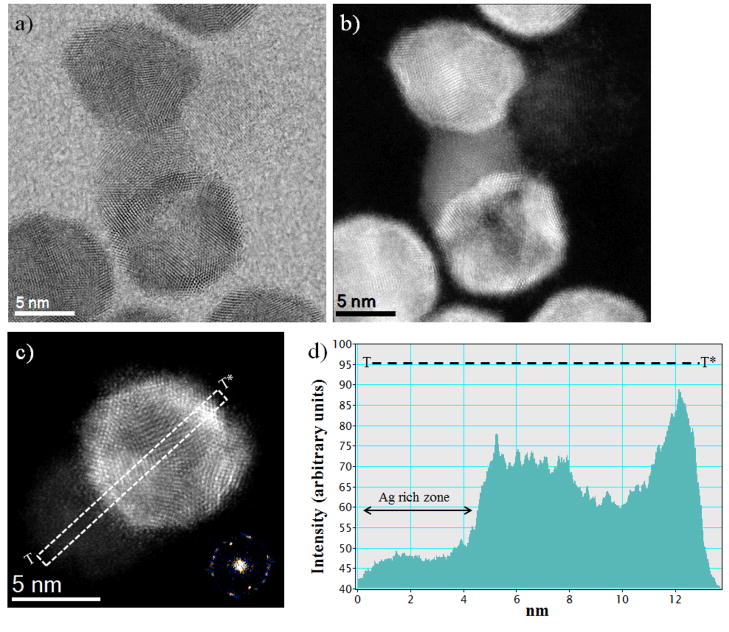
Fig. 5.
(a, b) Bright field and HAADF-STEM images of AgPd/Pt hollow structure nanoparticles showing the Ag atoms are moved to the surface region and also segregated from the structure, (c) AgPd/Pt nanoparticles with an Ag rich zone (left) and Pt rich shell hollow structure (right), and (d) Intensity profile (in arbitrary units) of a typical HAADF-STEM image shows a lower magnitude on the central portion on the particle (indicated as T – T*) due to the difference in the atomic number.
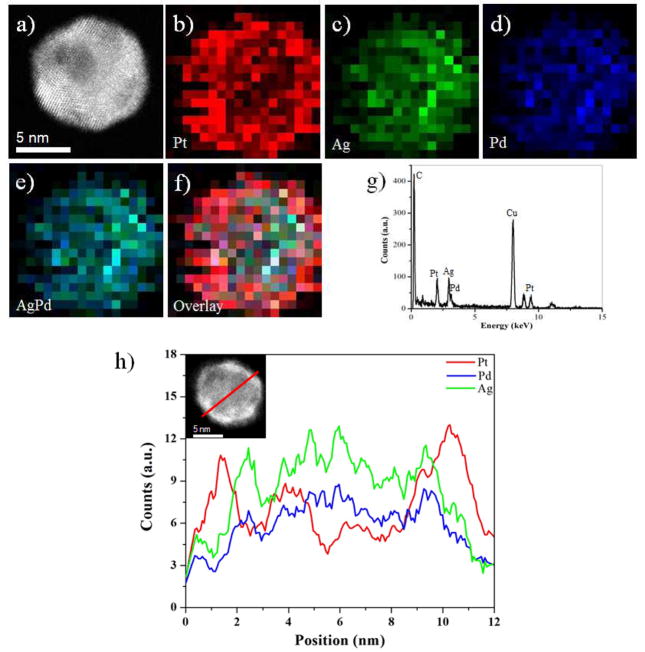
Fig. 3(a) correspond to a HAADF-STEM image of AgPd/Pt trimetallic multiple twinned nanostructures. The distributions of the Ag, Pd and Pt in the nanoparticles were studied by the energy dispersive X-ray spectroscopy (EDX) techniques implemented in the STEM mode. The EDX techniques were applied to investigate both elemental mapping and cross-sectional compositional line profiles on the nanostructures, which are two usual characterization techniques in the analysis of core-shell structures and elemental distributions on nanoparticles.48, 49 Here we can observe that the AgPd/Pt trimetallic MTPs are indeed core-shell. The signal due to Pt was readily observed, and it was found to be concentrated on the surface of the AgPd alloyed nanostructures (Fig. 3(b) and SI Fig. S2); however, the Ag and Pd signals were concentrated in the cores forming an AgPd alloy, as shown in Fig. 3(c–e). These converging color maps showed that the Pt atoms are overgrown on the surface of AgPd nano-alloys forming an overlay on the nanoparticles (Fig. 3(f)). However, it must be noted that the Pt deposit does not cover the whole AgPd surface, but instead it tends to conglomerate into separated regions (see Fig. 3(b)). The EDX spectrum of Fig. 3(g) confirmed the presence of Ag, Pd and Pt, and the compositional distribution of each element in the trimetallic nanoparticles was revealed by EDX line-scanning analysis. Fig. 3(h) and SI Fig. S3 shows characteristic line-scan EDX spectrua of Ag, Pd and Pt, measured from center of an individual nanoparticle (marked by a red line inset Fig. 3(h)) and towards the surface. The Pt signal was clearly traced across the entire particle (~ 11 nm), whereas the Ag and Pd signals were obtained only across the core region (~ 8 nm). Thus, the maximum intensity of the signals depends on the tendency of the elements to concentrate in a particular region of the particle.
Fig. 3.
(a) HAADF-STEM image of AgPd/Pt multiple twinned nanoparticles, (b–f) EDX elemental maps of nanoparticles – Pt (L, M), Ag (L), Pd (L), AgPd alloy and Overlay respectively, (g) EDX spectrum of corresponding AgPd/Pt multiply twinned nanoparticles, (h) Ag, Pd and Pt elemental profiles along the red line across the icosahedral structure (inset of h).
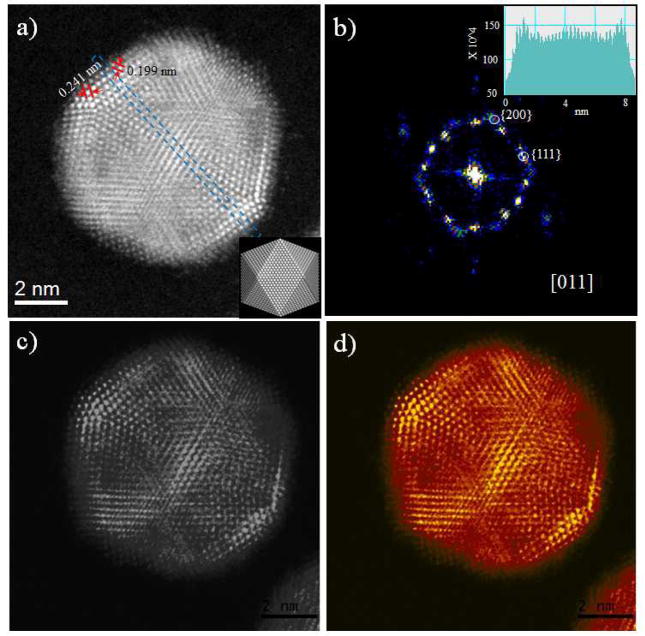
The Cs-corrected HAADF-STEM image of AgPd/Pt MTPs in Fig. 4(a) shows two regions of exceptionally different intensities, which demonstrates the tendency of the Pt atoms to be concentrated in the surface. The orientation of this icosahedral nanoparticle is along its 2-fold symmetry axis. The d-spacing of {111} plane in the Pt outer shell region was 0241 ± 0.026 nm, and the distances between {200} planes was found to be 0.199 ± 0.026 nm. The inset in the Figure corresponds to an atomistic model with the same orientation of the real particle. The spatial frequencies, obtained from the image’s Fast Fourier Transform (FFT) (Fig. 4(b)), indicates that the particle is oriented along its [011] zone axis, with (111) and (200) facets. The area marked in Fig. 4(a) represents an intensity measurement made of the nanoparticles as shown in the inset of Fig. 4(b). The intensities vary due both to the difference in the atomic number (Z) and to the thickness of the columns. These intensity profiles were consistently measured in other nanostructures in the AgPd/Pt samples (SI Fig. S4). The different colored images in Fig. 4(c) and (d) remark the contrast in the composition in different regions of the particles, with the low intensity corresponding to regions made of AgPd alloy, and higher intensities due to high concentrations of Pt.
Fig. 4.
Cs-corrected HAADF-STEM image of (a) AgPd/Pt nanoparticles with a Pt rich shell and AgPd rich core 2-fold symmetry axis orientated along [011] zone axis, the atomistic model is inset, (b) Fast Fourier Transform (FFT) of corresponding nanoparticles. The inset intensity profile (in arbitrary units) of the area marked in (a) showing the difference in the intensity due to the facts that ZPd < ZAg < ZPt, (c) and (d) Indicate that the different color contrast, showing the Pt shells partially covered the AgPd core surface.
While the formation of AgPd/Pt trimetallic nanoparticles with icosahedral morphology is likely due to the nucleation and growth of Pt atoms on the top of AgPd nanoalloy seeds, the HAADF-STEM images of some of the icosahedral nanoparticles show that Ag atoms have migrated to the surface region after being segregated from the trimetallic nanostructure, which results in the formation of hollow structure. These hollow structures can be obtained by carrying out nanocrystal growth using a metal ion with a higher reduction potential than the seed metal.26 In addition, the hollow structure can be obtained by the synthesis of a core-shell morphology followed by the subsequent removal of the core by either dissolution or decomposition,50 in a process that is governed both by thermodynamics and kinetics. These hollow nanoparticles are more active catalysts for various catalytic reactions, likely due to the increased surface area and lowered density.51, 52 Thus, the formation of these hollow structures promotes an efficient consumption of materials, with a corresponding improvement in the manufacturing cost of the catalyst. Fig. 5 shows representative images of these trimetallic hollow nanoparticles. The Bright Field and HAADF-STEM images of AgPd/Pt hollow structures show that Ag atoms move towards the shell region and also segregated from the structure, as shown in Fig. 5(a) and (b) respectively. The decrease in the number of neighboring Pt atoms favors the segregation of Ag atoms, which promotes the creation of a PtAg alloyed surface.37, 53 This alloy helps to reduce the number of adsorption sites for poisoning species that would slow down the electrocatalytic reaction in polymer electrolyte membrane fuel cells (PEMFCs).54, 55 The panel c of Fig. 5 presents representative data for the AgPd/Pt nanoparticles with an Ag rich zone (left) and Pt rich shell hollow structure (right). The intensity profile shown in Fig. 5(d), corresponding to the region marked in Fig. 5(c), shows an Ag-rich zone (low intensity), in contrast to the right side, higher intensity zone.
The nucleation and growth of Pt atoms on Ag0.5Pd0.5 nanoalloy seeds have been studied using grand canonical Monte Carlo (GCMC) simulations in order support the observed experimental findings. We have found that Pt regions tend to grow on AgPd seeds at overpotentials, i.e., at negative potentials relative to the Nernst potential of Pt. In Fig. 5 some selected snapshots of the atomic configurations extracted from the GC-MC simulations at different coverage degree (θ) are shown. It can be noted in Fig. 5 (a) and (e) that the initial Pt ad-atoms start to nucleate at non preferential surface sites, a different situation to that reported for systems presenting the underpotential (UPD) phenomena,41, 56 where selective decoration of facets can be controlled. The growth of Pt layers on AgPd alloys precedes in a way which resembles the well-known Volmer-Weber mode, where 3D phase formation takes place, due to the strong Pt-Pt interaction compared to Pt-Ag and Pt-Pd interactions, see Fig. 5 (b) and (f) which correspond to a coverage degree of 0.5 ML in both cases.
The final configurations of the GC-MC simulations (Fig. 5 (c) and (g), which correspond to θ = 1ML) were used as input coordinates for the simulation of HAADF-STEM microscopy. For these simulations we used the multislice method as implemented in the xHREM package, by Ishizuka,57 that uses an algorithm based on Fast Fourier Transforms. In Fig. 5 (d) and (h) the STEM simulation images corresponding to configurations (c) and (g) respectively are shown. It can be noted how the regions of the nanoparticle enriched in Pt appears brighter due to the Z-contrast feature of STEM. These images are in very good agreement (see also SI Fig. S6) with the experimental images (showed above), taken with the JEOL JEM-ARM 200F microscope, where some platinum regions on the surface of the AgPd nanoalloys are observed.
By means of Monte Carlo simulations in the grand canonical ensemble, we have been able to reproduce a number of morphologies obtained experimentally for trimetallic AgPd/Pt nanoparticles. For instance, using atomic inspection and radial distribution functions, we can determine the special distribution of Ag, Pd and Pt, and we found that Pt atoms were mainly concentrated in the outer surface (as observed experimentally in STEM-EDX images). Even more, the simulated STEM images shows the same z-contrast behaviour than those obtained experimentally. It is clear that agglomeration of Pt is required to growth Pt over AgPd nanoalloys, otherwise Pt is expected to be inside the NPs.
5. Conclusions
In summary, AgPd/Pt trimetallic multiple twinned core-shell nanoparticles have been synthesized through a facile synthesis method, where the AgPd core gets partially encapsulated in a Pt rich shell. The TEM results show that the final morphologies of the AgPd alloy seeds have icosahedral structure, which in the end promotes the appearance of icosahedral shapes. Cs-corrected STEM, in combination with high resolution spectral and chemical analysis, has allowed us to study the atomic structure of AgPd/Pt trimetallic nanoparticles, and the chemical compositions of the different region of the particles were measured by STEM-EDX analysis. Additionally, we found that some of the Ag atoms moved towards the surface region and also segregated from the nanostructure, which results in the formation of hollow cage-like structures. The use of high resolution HAADF-STEM imaging allowed us to study the atomic positions of Ag, Pd, and Pt, and the distribution of Pt in the surface can be explained by energetic arguments using theoretical DFT calculations and grand canonical Monte Carlo (GCMC) simulations.
By using GCMC simulations, we have been able to study the nucleation and growth of Pt deposits on AgPd nanoalloys. The morphologies obtained with the simulations are in good agreement with the experimental findings. From the simulations results it can be concluded that Pt grows at overpotentials, following a Volmer-Weber mode, i.e. with the formation of 3D islands and the subsequent coalescence. This is an important finding in view of previous works in underpotential (UPD) systems, where selective decoration of facets can be achieved by means of chemical potential control.
Supplementary Material
Fig. 6.
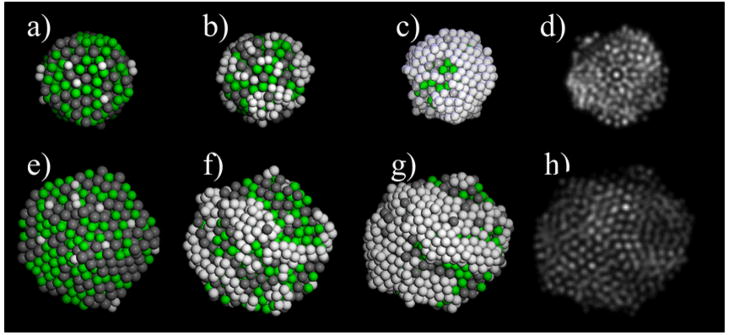
Atomic configurations obtained from the GC-MC simulations of Ag0.5Pd0.5 icosahedra (upper panel) and decahedra (lower panel). Initial stage of Pt nucleation on Ag0.5Pd0.5 (a) and (e). Formation of a Pt deposit on AgPd at θ = 0.5 ML (b and f) and θ = 1 ML (c and g). STEM simulations of configurations at θ = 1 ML (d) and (h), see the text for details and SI for additional STEM simulations.
Acknowledgments
This project was supported by grants from the National Center for Research Resources (5 G12RR013646-12) and the National Institute on Minority Health and Health Disparities (G12MD007591) from the National Institutes of Health. The authors would like to acknowledge to NSF for its support through grants DMR-1103730, “Alloys at the Nanoscale: The Case of Nanoparticles Second Phase, and PREM: NSF PREM Grant # DMR 0934218; “Oxide and Metal Nanoparticles-The Interface Between Life Sciences and Physical Sciences”. MMM wish to thank CONICET, SeCyT UNC, ANPCyT Program BID (PICT 2010-123), PIP: 112-200801-000983 “Nanotechnology in-silico” for financial support. Support from Conacyt, through project CIAM 148967, is also acknowledged. We also acknowledge support by the Welch Foundation (Grant AX-1615)
References
- 1.Fang PP, Duan S, Lin XD, Anema JR, Li JF, Buriez O, Ding Y, Fan FR, Wu DY, Ren B. Chem Sci. 2011;2:531. [Google Scholar]
- 2.Patra S, Yang H. Bull Korean Chem Soc. 2009;30:1485. [Google Scholar]
- 3.Venkatesan P, Santhanalakshmi J. Langmuir. 2010;26:12225. doi: 10.1021/la101088d. [DOI] [PubMed] [Google Scholar]
- 4.Viet Long N, Yang Y, Minh Thi C, Nogami M. Nano Energ. 2013 http://dx.doi.org/10.1016/j.nanoen.2013.06.001.
- 5.Khanal S, Casillas G, Bhattarai N, Velazquez-Salazar JJ, Santiago U, Ponce A, Mejia-Rosales SJ, Jose-Yacaman M. Langmuir. 2013;29:9231–9239. doi: 10.1021/la401598e. [DOI] [PMC free article] [PubMed] [Google Scholar]
- 6.Long NV, Duy Hien T, Asaka T, Ohtaki M, Nogami M. Int J Hydrogen Energ. 2011;36:8478–8491. [Google Scholar]
- 7.Sasaki K, Naohara H, Cai Y, Choi YM, Liu P, Vukmirovic MB, Wang JX, Adzic RR. Angew Chem Int Ed. 2010;49:8602–8607. doi: 10.1002/anie.201004287. [DOI] [PubMed] [Google Scholar]
- 8.Service RF. Science. 2007;315:172. doi: 10.1126/science.315.5809.172. [DOI] [PubMed] [Google Scholar]
- 9.Koenigsmann C, Santulli AC, Gong K, Vukmirovic MB, Zhou W-p, Sutter E, Wong SS, Adzic RR. J Am Chem Soc. 2011;133:9783–9795. doi: 10.1021/ja111130t. [DOI] [PubMed] [Google Scholar]
- 10.Shao M. J Power Sources. 2011;196:2433–2444. [Google Scholar]
- 11.Khanal S, Casillas G, Velazquez-Salazar JJ, Ponce A, Jose-Yacaman M. J Phys Chem C. 2012;116:23596–23602. doi: 10.1021/jp3092418. [DOI] [PMC free article] [PubMed] [Google Scholar]
- 12.Chen A, Holt-Hindle P. Chem Rev. 2010;110:3767–3804. doi: 10.1021/cr9003902. [DOI] [PubMed] [Google Scholar]
- 13.Hong JW, Kang SW, Choi BS, Kim D, Lee SB, Han SW. ACS Nano. 2012;6:2410–2419. doi: 10.1021/nn2046828. [DOI] [PubMed] [Google Scholar]
- 14.Lim B, Jiang M, Camargo PH, Cho EC, Tao J, Lu X, Zhu Y, Xia Y. Science. 2009;324:1302–1305. doi: 10.1126/science.1170377. [DOI] [PubMed] [Google Scholar]
- 15.Peng Z, Yang H. J Am Chem Soc. 2009;131:7542–7543. doi: 10.1021/ja902256a. [DOI] [PubMed] [Google Scholar]
- 16.Bhattarai N, Casillas G, Khanal S, Salazar JJ, Ponce A, Jose-Yacaman M. J Nanopart Res. 2013;15:1–13. [Google Scholar]
- 17.Wang R, Wang H, Wei B, Wang W, Lei Z. Int J Hydrogen Energ. 2010;35:10081–10086. [Google Scholar]
- 18.Mani P, Srivastava R, Strasser P. J Power Sources. 2011;196:666–673. [Google Scholar]
- 19.Zhang GR, Wu J, Xu BQ. J Phys Chem C. 2012;116:20839–20847. [Google Scholar]
- 20.Golikand A, Lohrasbi E, Maragheh M, Asgari M. J Appl Electrochem. 2009;39:2421–2431. [Google Scholar]
- 21.Kadirgan F, Beyhan S, Atilan T. Int J Hydrogen Energ. 2009;34:4312–4320. [Google Scholar]
- 22.Kobayashi H, Yamauchi M, Kitagawa H, Kubota Y, Kato K, Takata M. J Am Chem Soc. 2010;132:5576–5577. doi: 10.1021/ja1013163. [DOI] [PubMed] [Google Scholar]
- 23.Tedsree K, Li T, Jones S, Chan CWA, Yu KMK, Bagot PA, Marquis EA, Smith GD, Tsang SCE. Nat nanotechnol. 2011;6:302–307. doi: 10.1038/nnano.2011.42. [DOI] [PubMed] [Google Scholar]
- 24.Yang J, Yang J, Ying JY. ACS Nano. 2012;6:9373–9382. doi: 10.1021/nn303298s. [DOI] [PubMed] [Google Scholar]
- 25.Safavi A, Kazemi H, Momeni S, Tohidi M, Khanipour Mehrin P. Int J Hydrogen Energ. 2013 [Google Scholar]
- 26.Peng Z, Wu J, Yang H. Chem Mater. 2009;22:1098–1106. [Google Scholar]
- 27.Toshima N, Ito R, Matsushita T, Shiraishi Y. Catal Today. 2007;122:239–244. [Google Scholar]
- 28.Tsai SH, Liu YH, Wu PL, Yeh CS. J Mater Chem. 2003;13:978–980. [Google Scholar]
- 29.Toshima N. Macromol Sy. 2008;270:27–39. [Google Scholar]
- 30.Wang L, Yamauchi Y. J Am Chem Soc. 2010;132:13636–13638. doi: 10.1021/ja105640p. [DOI] [PubMed] [Google Scholar]
- 31.Wang L, Yamauchi Y. Chem Mater. 2011;23:2457–2465. [Google Scholar]
- 32.Zhang H, Okumura M, Toshima N. J Phys Chem C. 2011;115:14883–14891. [Google Scholar]
- 33.Rossi G, Ferrando R, Rapallo A, Fortunelli A, Curley BC, Lloyd LD, Johnston RL. J chem phys. 2005;122:194309. doi: 10.1063/1.1898224. [DOI] [PubMed] [Google Scholar]
- 34.Negreiros FR, Kuntová Z, Barcaro G, Rossi G, Ferrando R, Fortunelli A. J Chem Phys. 2010;132:234703. doi: 10.1063/1.3442911. [DOI] [PubMed] [Google Scholar]
- 35.Negreiros FR, Barcaro G, Kuntová Z, Rossi G, Ferrando R, Fortunelli A. Surf Sci. 2011;605:483–488. [Google Scholar]
- 36.Paz-Borbón LO, Johnston RL, Barcaro G, Fortunelli A. J Chem Phys. 2008;128:134517. doi: 10.1063/1.2897435. [DOI] [PubMed] [Google Scholar]
- 37.Negreiros F, Taherkhani F, Parsafar G, Caro A, Fortunelli A. J Chem Phys. 2012;137:194302. doi: 10.1063/1.4759507. [DOI] [PubMed] [Google Scholar]
- 38.Barcaro G, Fortunelli A, Polak M, Rubinovich L. Nano Letters. 2011;11:1766–1769. doi: 10.1021/nl200322s. [DOI] [PubMed] [Google Scholar]
- 39.Yang Y, Gong X, Zeng H, Zhang L, Zhang X, Zou C, Huang S. J Phys Chem C. 2009;114:256–264. [Google Scholar]
- 40.Zhang S, Metin Ö, Su D, Sun S. Angew Chem Int Ed. 2013;52:3681–3684. doi: 10.1002/anie.201300276. [DOI] [PubMed] [Google Scholar]
- 41.Mariscal MM, Oviedo OA, Leiva EPM. J Mater Res. 2012;27:1777–1786. [Google Scholar]
- 42.Mariscal MM, Velázquez-Salazar JJ, Yacaman MJ. CrystEngComm. 2012;14:544–549. [Google Scholar]
- 43.Foiles SM, Baskes MI, Daw MS. Phys Rev B. 1986;33:7983–7991. doi: 10.1103/physrevb.33.7983. [DOI] [PubMed] [Google Scholar]
- 44.Zhang Q, Lee JY, Yang J, Boothroyd C, Zhang J. Nanotechnology. 2007;18:245605. [Google Scholar]
- 45.Wang C, Peng S, Chan R, Sun S. Small. 2009;5:567–570. doi: 10.1002/smll.200801169. [DOI] [PubMed] [Google Scholar]
- 46.Methfessel M, Hennig D, Scheffler M. Phys Rev B. 1992;46:4816–4829. doi: 10.1103/physrevb.46.4816. [DOI] [PubMed] [Google Scholar]
- 47.Ling T, Xie L, Zhu J, Yu H, Ye H, Yu R, Cheng Z, Liu L, Yang G, Cheng Z, Wang Y, Ma X. Nano Lett. 2009;9:1572–1576. doi: 10.1021/nl8037294. [DOI] [PubMed] [Google Scholar]
- 48.Ferrer D, Torres-Castro A, Gao X, Sepúlveda-Guzmán S, Ortiz-Méndez U, José-Yacamán M. Nano Lett. 2007;7:1701–1705. doi: 10.1021/nl070694a. [DOI] [PubMed] [Google Scholar]
- 49.Lim B, Wang J, Camargo PHC, Jiang M, Kim MJ, Xia Y. Nano Lett. 2008;8:2535–2540. doi: 10.1021/nl8016434. [DOI] [PubMed] [Google Scholar]
- 50.Caruso F. Chem- Eur J. 2000;6:413–419. doi: 10.1002/(sici)1521-3765(20000204)6:3<413::aid-chem413>3.0.co;2-9. [DOI] [PubMed] [Google Scholar]
- 51.Liang HP, Guo YG, Zhang HM, Hu JS, Wan LJ, Bai CL. Chem Commun. 2004;0:1496–1497. doi: 10.1039/b402745k. [DOI] [PubMed] [Google Scholar]
- 52.Cui C, Gan L, Heggen M, Rudi S, Strasser P. Nat Mater. 2013 doi: 10.1038/nmat3668. [DOI] [PubMed] [Google Scholar]
- 53.Deng L, Deng H, Xiao S, Tang J, Hu W. Faraday Disc. 2013;162:293–306. doi: 10.1039/c3fd20138d. [DOI] [PubMed] [Google Scholar]
- 54.Xu J, Zhao T, Liang Z. J Phys Chem C. 2008;112:17362–17367. [Google Scholar]
- 55.Choi JH, Jeong KJ, Dong Y, Han J, Lim TH, Lee JS, Sung YE. J Power Sources. 2006;163:71–75. [Google Scholar]
- 56.Personick ML, Langille MR, Zhang J, Mirkin CA. Nano Lett. 2011;11:3394–3398. doi: 10.1021/nl201796s. [DOI] [PubMed] [Google Scholar]
- 57.Ishizuka K. Ultramicroscopy. 2002;90:71–83. doi: 10.1016/s0304-3991(01)00145-0. [DOI] [PubMed] [Google Scholar]
Associated Data
This section collects any data citations, data availability statements, or supplementary materials included in this article.


