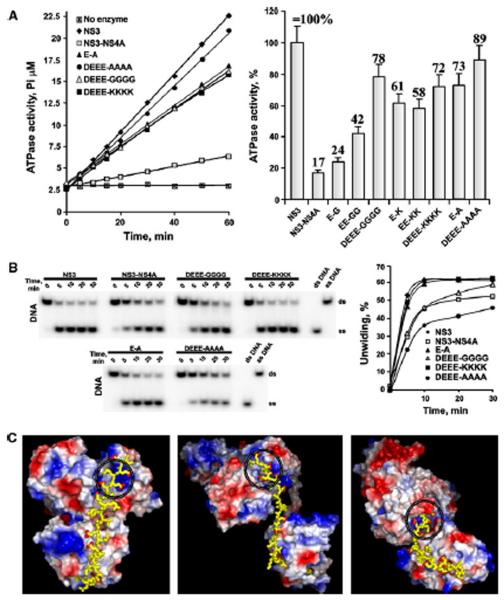
Fig. 2.
NS4A mutants affect the ATPase activity of NS3 helicase. A, The ATPase activity of the wild-type and mutant constructs. Left, the reactions were performed for the indicated times using 1 mM ATP. Right, the ATPase activity of the constructs (at the 30 min time point) relative to NS3 alone (set as 100%). Error bars indicate SEM. Experiments were repeated multiple times with similar results. The E-G, EE-GG, E-K and EE-KK mutants are omitted in panel B for clarity. B, NS4A mutants do not significantly affect the unwinding activity of NS3 helicase. Left, the DNA unwinding efficiency of the mutants. Right, the images on the left were digitized, and the band density was calculated. The time course of the conversion of the ds-DNA substrate band into the ss-DNA product band is shown to demonstrate the initial rate of DNA duplex unwinding. Experiments were repeated multiple times with similar results. The E-G, EE-GG, E-K and EE-KK mutants are omitted for the clarity. ds and ss, double-and single-stranded, respectively. C, Three alternative potential structures of HCV NS3-NS4A. The structures are shown as surface models of NS3hel and NS3pro [the top and the bottom domains, respectively, colored according to their electrostatic potential (blue, positive; red, negative)]. The C-terminal sequence AIIPDREVLYREFDEMEEC of HCV NS4A is shown as yellow sticks. Red dots indicate the carboxyl oxygens of Asp and Glu. The ATP-binding site is circled. The models were build using PyMol, with the crystal structures of HCV (PDB 1CU1; left), Murray Valley encephalitis virus (PDB 2WV9; middle) and DV4 NS3 (PDB 2VBC; right) as templates

