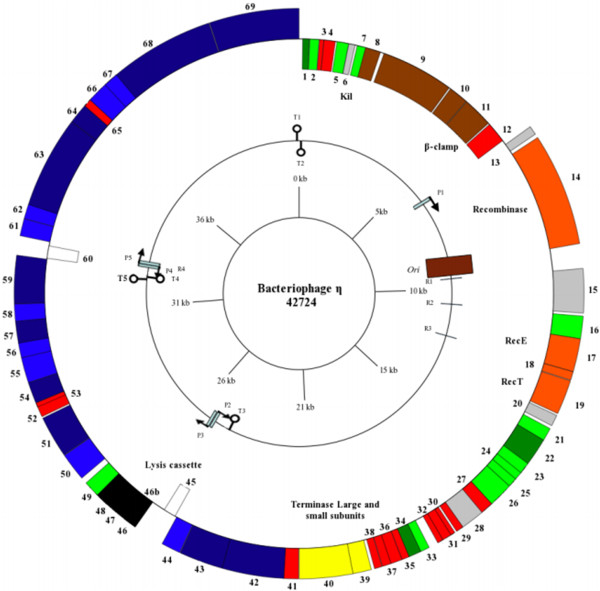
Figure 3.

Genetic map of η. The genes are color coded according to function with red: novel, light green: prophage or bacterial related, dark green: phage related, black: lysis cassette, orange: recombination, brown: replication, yellow: packaging related, dark blue; confirmed structural, light blue: hypothetical, white: morons, grey: possible DNA binding and Kil. Promoters (P), terminators (T), direct repeats (R) and the ori are also included. Promoters are indicated with black arrows on stalks, while rho-independent terminators are indicated  . The GenomeVx software package was used to construct this figure.
