
Figure 1.
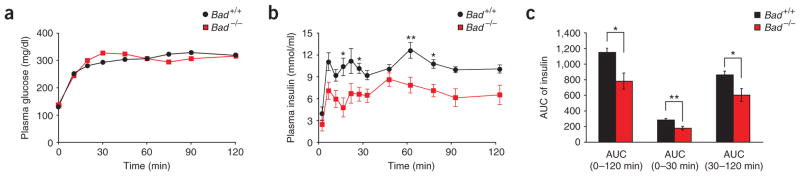
Impaired insulin secretion in Bad −/− mice. Plasma glucose (a) and insulin (b) levels and the area under the curve (AUC) for insulin secretion (c) during hyperglycemic clamp studies performed on overnight fasted Bad +/+ (n = 10) and Bad −/− (n = 12) mice. *P < 0.05, **P < 0.01, Bad +/+ versus Bad −/− mice, unpaired, two-tailed t-test.