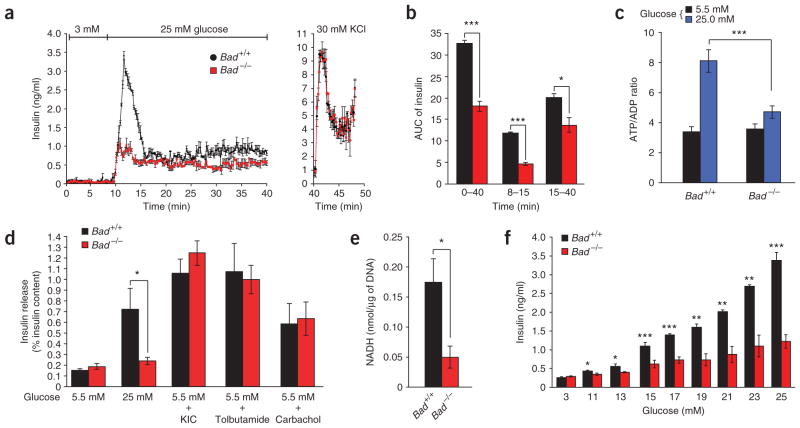
Figure 2.
Characterization of the insulin secretion defect in Bad −/− islets. (a) Islet perifusion. Data are means ± s.e.m. of four independent experiments. DNA content per islet was 12.09 ± 0.65 ng and 13.17 ± 0.95 ng for Bad +/+ and Bad −/− mice, respectively. (b) AUC for insulin throughout the perifusion (min 0–40), first phase (min 8–15) and second phase (min 15–40) of release in a. (c) Glucose-induced changes in ATP/ADP ratio in Bad +/+ and Bad −/−islets. (d) Insulin release in response to 10 mM α-ketoisocaproic acid (KIC), 0.25 mM tolbutamide or 0.25 mM carbachol, as measured by static incubation method. Data are means ± s.e.m. of four separate experiments. Insulin content per islet was 115.1 ± 4.64 and 118.49 ± 4.09 ng, Bad +/+ and Bad −/−, respectively. (e) Glucokinase activity in homogenates of primary islets isolated from Bad +/+ and Bad −/− mice. Data represent means ± s.e.m. of four independent measurements. (f) Insulin secretion in Bad +/+ and Bad −/− islets perifused with increasing concentration of glucose. Data are means ± s.e.m. of four independent experiments. *P < 0.05, **P < 0.01, ***P < 0.001, Student’s t-test.

