Fig. 2.
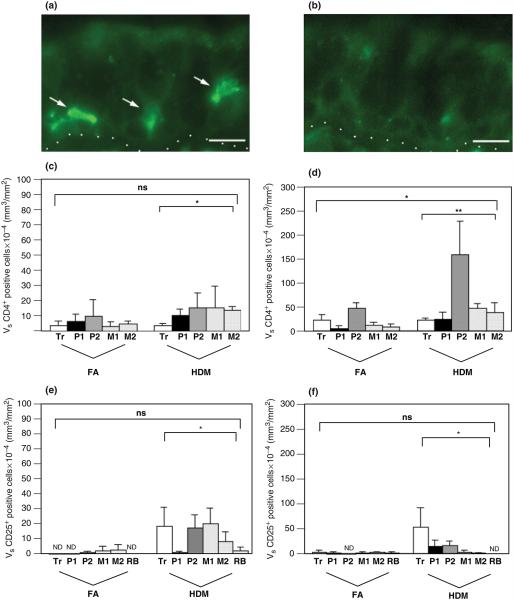
Distribution of CD4+ lymphocytes and CD25+ cells within airway mucosa of HDM-challenged rhesus monkeys. CD3+/CD4+ lymphocytes and CD25+ cells were quantitated by immunofluorescence staining of trachea and left caudal lobe sections obtained from HDM-challenged monkeys. Tr, P1, P2, M1, M2, and RB represent cryosections obtained from tissue blocks of trachea and regions progressively representing the most proximal (P1) to distal (RB) intrapulmonary airways of the lobe. Columns represent the average volume ± SE of CD3+/CD4+ or CD25+ staining cells (mm3) with respect to the surface area of basal lamina (mm2). FA, filtered air control; HDM, house dust mite-challenged; RB, respiratory bronchiole. (a) CD25+ immunofluorescence staining of a mid-level intrapulmonary airway (M1) from a representative HDM monkey. The dotted line defines the basement membrane of the region; the epithelium is above the line, and the interstitium is below the line. Arrows point to three CD25+ cells (green) within the epithelium. Bar=10 μm. (b) Control staining of an adjacent section using an FITC-conjugated mouse IgG1 isotype control. Bar=10 μm. (c) Abundance of CD3+/CD4+ fluorescence double-positive lymphocytes within the epithelial compartment of conducting airways. *P=0.07 by analysis of variance (treatment effect). (d) Abundance of CD3+/CD4+ fluorescence double-positive lymphocytes within the interstitial compartment of conducting airways. *P=0.0007 by analysis of variance (block effect); **P=0.0037 by analysis of variance (treatment effect). (e) Abundance of CD25+ cells within the epithelial compartment of conducting airways. *P=0.0044 by analysis of variance (treatment effect). (f) Abundance of CD25+ cells within the interstitial compartment of conducting airways. *P=0.0818 by analysis of variance (treatment effect).

