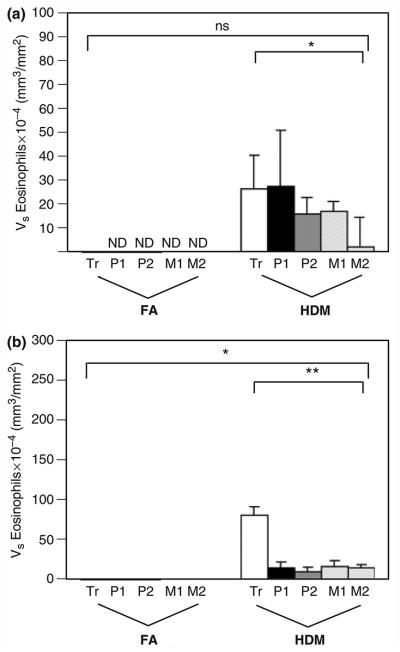
Fig. 4.

Distribution of eosinophils within airway mucosa of HDM-challenged rhesus monkeys. Eosinophils were quantitated from H&E staining of trachea and right middle lobe sections obtained from HDM-challenged monkeys. Tr, P1, P2, M1, and M2 represent cryosections obtained from tissue blocks of trachea and regions progressively representing the most proximal (P1) to mid-level intrapulmonary airways of the lobe. Columns represent the average volume ± SE of eosinophils (mm3) within the specified compartment with respect to the surface area of basal lamina (mm2). FA, filtered air control; HDM, house dust mite-challenged. (a) Abundance of eosinophils within the epithelial compartment of conducting airways. *P=0.0046 by analysis of variance (treatment effect). (b) Abundance of eosinophils within the interstitial compartment of conducting airways. *P<0.0001 by analysis of variance (block effect); **P<0.0001 by analysis of variance (treatment effect).
