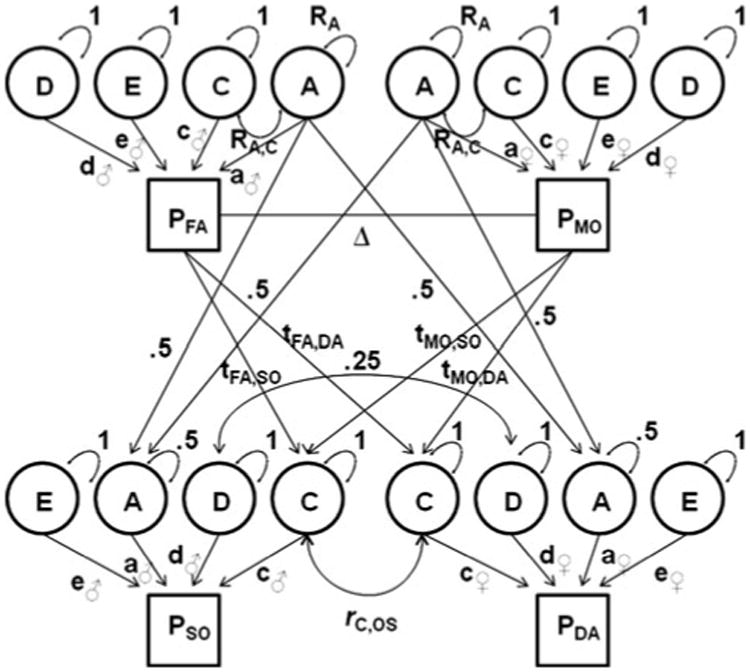
Fig. 1.

Path diagram for variance decomposition (shown for DOS twin pair with parents). Pfa, Pmo, Pso, Pda phenotype of father, mother, son, daughter, A additive genetic factor with variance Ra (differs from 1 in the case of phenotypic assortment), D non-additive genetic factor, C shared environmental factor with variance Rc (differs from 1 in the case of shared environmental transmission), E individual-specific environmental factor, a, c, d, e path loadings (d-paths estimated in ACDE model; set to zero in ACE model with shared environmental transmission), tfa,so, tfa,da, tmo,so, tmo,da shared environmental transmission paths (estimated in ACE model with shared environmental transmission; set to zero in ACDE model), Ra,c covariation between A and C (differs from 1 in the case of shared environmental transmission), rc,os correlation between shared environmental factors for opposite-sex, Δ path representing correlations between the latent factors induced by phenotypic assortment, ♂ male-specific path loadings, ♀ female-specific path loadings
