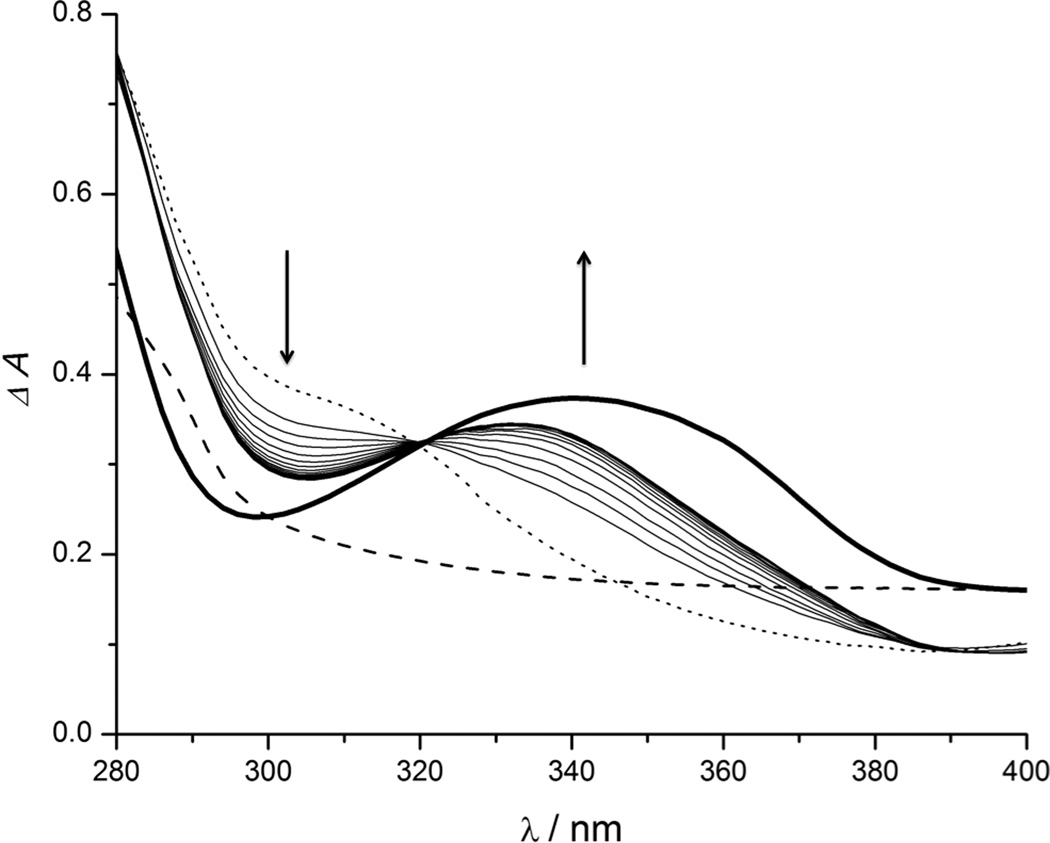
Figure 2.
Absorption spectra of 11 in the presence of PLE monitored every 30 sec for 8 min. The dotted line represents initial absorbance spectrum. The dashed line represents an authentic spectrum of 4-hydroxybenzyl alcohol, and the bold solid line depicts the absorption of an authentic sample of 1,2-HOPO-2. The arrows indicate spectral change over time.

