
Figure 3.
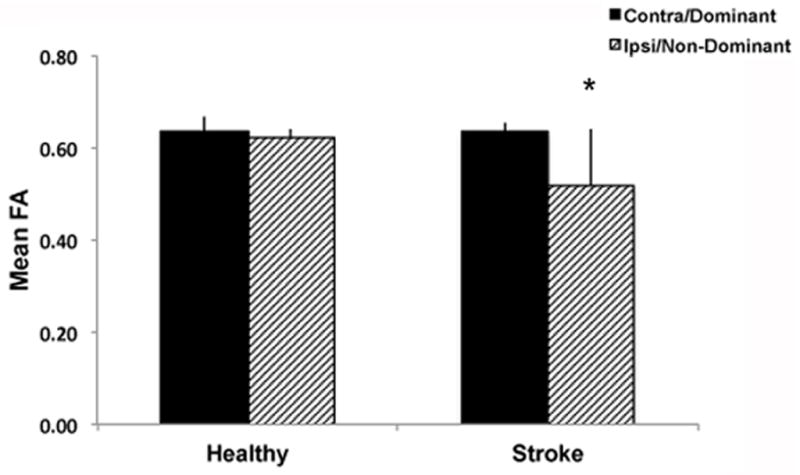
Mean post-training FA values from for dominant and non-dominant PLICs for healthy controls and ipsi- and contralateral PLICs for individuals with stroke. Reduced post-training mean FA was observed in the ipsilesional PLIC in the stroke group compared to the non-dominant PLIC in the healthy control group (*p<0.05). Error bars are standard deviation of the mean (SD).