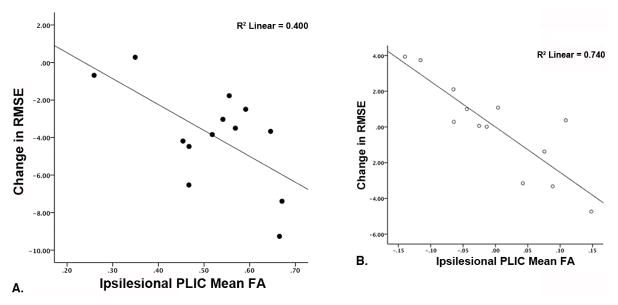
Figure 4.

A) Scatterplot depicting the bivariate relationship between change in tracking performance (root mean square error, RMSE) and post-training ipsilesional PLIC FA values. Tracking performance improvements (more negative RMSE change scores) were correlated with higher post-training ipsilesional PLIC mean FA values. B) Partial residual plot illustrating the relationship between change RMSE and post-training ipsilesional PLIC FA after regressing each separately on age and post-stroke duration. The amount of variance in change in RMSE explained by post-training ipsilesional PLIC FA was increased after accounting for the variance in RMSE change explained by age and post-stroke duration.
