
Figure 5.
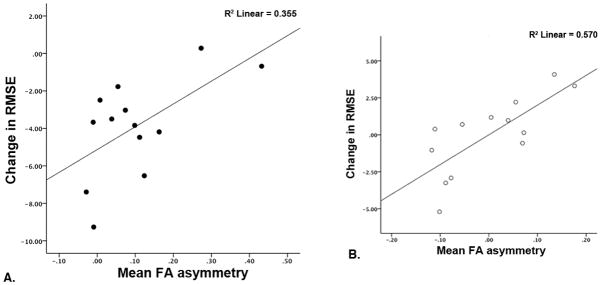
A) Scatterplot depicting the bivariate relationship between change in RMSE and post-training hemispheric PLIC FA asymmetry values. Performance improvements were associated with reduced post-training hemispheric PLIC FA asymmetry. B) Partial residual plot illustrating the relationship between change in RMSE and post-training hemispheric PLIC FA asymmetry after regressing each separately on age and post-stroke duration.