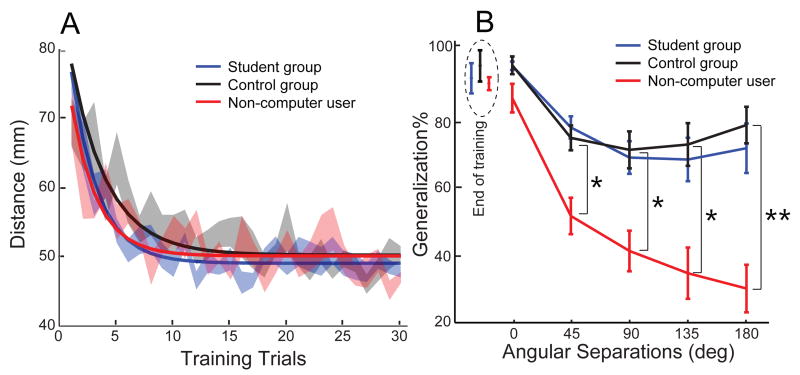
Figure 2.
Same learning speeds but different generalization. A). Average learning data during the training phase. The error bars denote SEMs across subjects. Solid lines are fitted exponential learning curves. B). The generalization as a function of difference in direction is assessed. The difference between computer-user groups and non-computer user group was significant at distant angles (p < .005, marked as *, p <.001, marked as **, simple main effect with Bonferroni correction).

