Fig. 4.
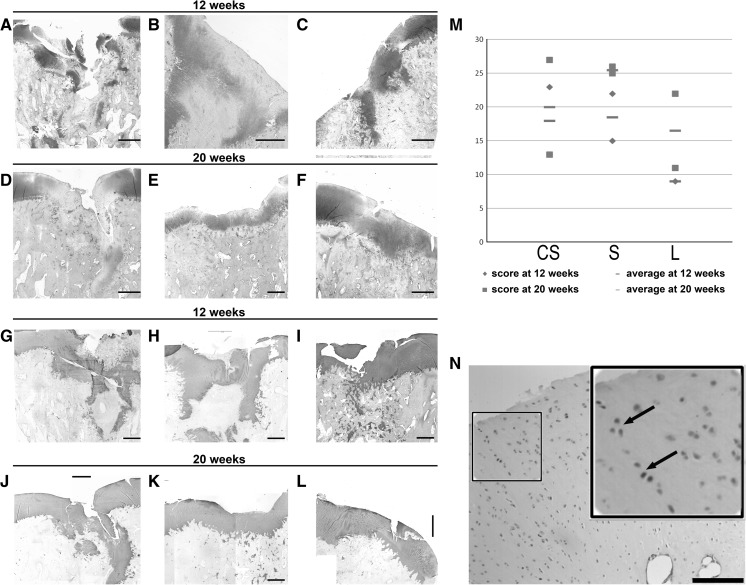
Histochemical analysis of paraffin sections of cartilage specimens. In the left top panels, images from samples taken at 12 and 20 weeks post-operatively stained with Safranin O. In the left bottom panels, Collagen II immunostainings from samples taken at 12 and 20 weeks post-operatively. a, g Untreated knee (sample F12left); b, h defect treated with cell-free PLGA scaffold (F14left); c, i defect treated with cell-seeded PLGA scaffold (sample F6right); d, j untreated knee (sample F17left); e, k defect treated with cell-free PLGA scaffold (F16right); f, l defect treated with cell-seeded PLGA scaffold (sample F17right). m Graphical representation of the scores obtained at 12 and 20 weeks grouped together according to each treatment, where the average from each group is also graphically represented to highlight the similarity in their values. n Section from a knee treated with PLGA scaffolds loaded with chondrocytes (sample F16left) and stained for Sox9 (inset: zoomed view with arrows pointing to Sox9 positive cells). CS cell-seeded scaffold, S scaffold, L untreated lesion. Scale bar 600 μm

