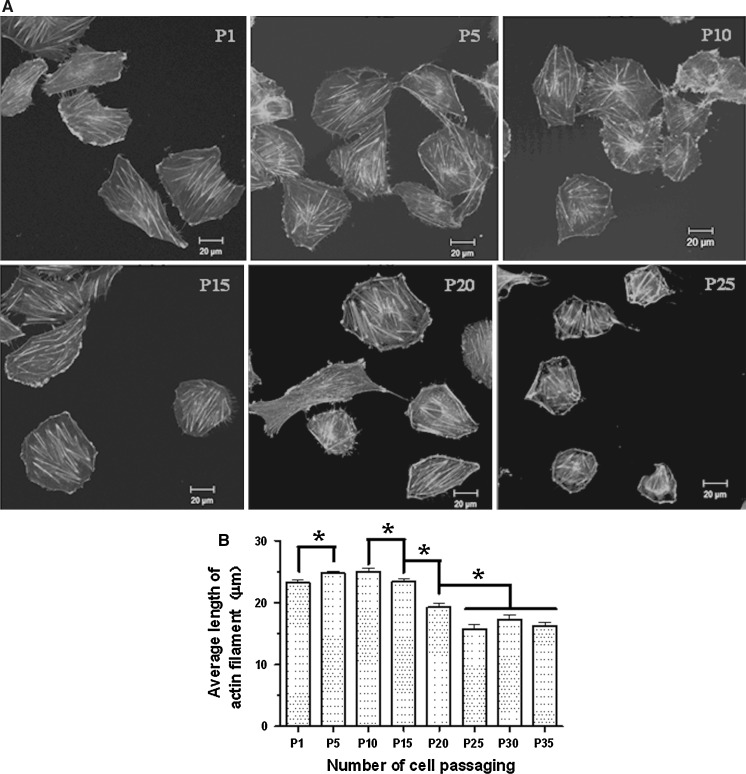
Fig. 2.
Effects of cell passaging on actin filaments of HUVECs. a Representative confocal images show the fluorescently labeled actin filaments in the cells at passages 1, 5, 10, 15, 20, and 25 (P1, P5, P10, P15, P20, and P25), respectively. b The average length of actin filaments at each passage. Values are expressed as mean ± SEM (n ≥ 350 from three independent experiments; asterisk, P < 0.05)

