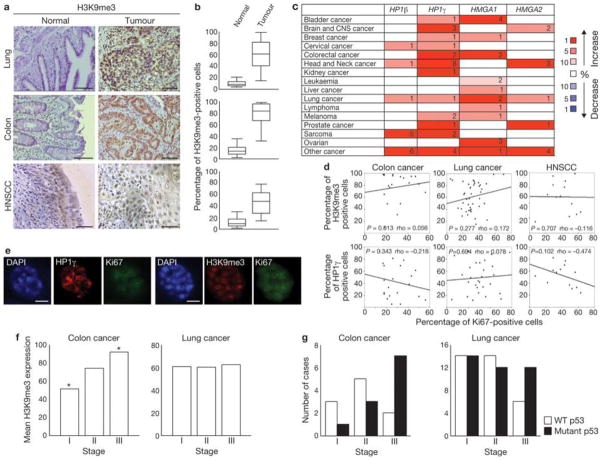
Figure 5. Increased heterochromatin is retained in human tumours in vivo in different stages of cancer progression.
(a) Immunohistochemistry analysis of lung, colon (scale bars, 200 μm) and HNSCC (scale bars, 100 μm) samples. Tumoral sections show increased accumulation of H3K9me3, compared with normal epithelium. (b) Box plots indicate the percentage of H3K9me3-positive cells in normal epithelium (left box) and tumour samples (right box). Error bars represent 95% confidence intervals. For all cancer types, P < 0.001 for normal versus tumoral tissues; Mann-Whitney test was used for this analysis. Lung, n = 42; colon, n = 20; head and neck, n = 15. The data for the box plots derive from the immunohistochemical analyses in a. (c) Summary of HP1γ, HP1β, HMGA1 and HMGA2 expression analyses using data from the Oncomine database. Heterochromatin components are upregulated in several human cancers, compared with normal tissues. Numbers in the table indicate numbers of studies with a threshold of P < 0.0001 for normal versus tumoral tissues and with a threshold of expression fold change ≥ 2. Genes are further classified according to expression fold change. The percentage indicates whether the fold change in the expression of the gene is included among 1%, 5% or 10% of the genes most upregulated or downregulated. Increase or decrease is visualized by the colour code. Note: an analysis may be counted in more than one cancer type. (d) Scatter plots indicate the correlation between Ki67 expression and H3K9me3 (top) and HP1γ (bottom) expression, in colon, lung and HNSCC cells. P values (> 0.05 in all cases) and Spearman Correlation (rho) are indicated. (e) Immunofluorescence microscopy of heterochromatin markers at single-cell level in HNSCC samples. H3K9me3- or HP1γ-positive structures can be seen in Ki67-expressing cells. Scale bars, 4 μm. (f) H3K9me3 expression in colon and lung carcinomas at different stages. Histograms indicate that H3K9me3 expression in colon and lung carcinomas is not reduced at more advanced stages. H3K9me3 expression is significantly increased in stage III colon carcinomas in comparison to stage I cases (Asterisk indicates P < 0.05, One-way ANOVA). No statistical significant differences were detected among the tumoral stages in lung cancer. (g) Histograms indicate the progressive loss of wild-type p53 or the progressive increase of p53 mutant cases in later stages of colon and lung carcinomas. Colon, n= 21; lung, n = 66.

