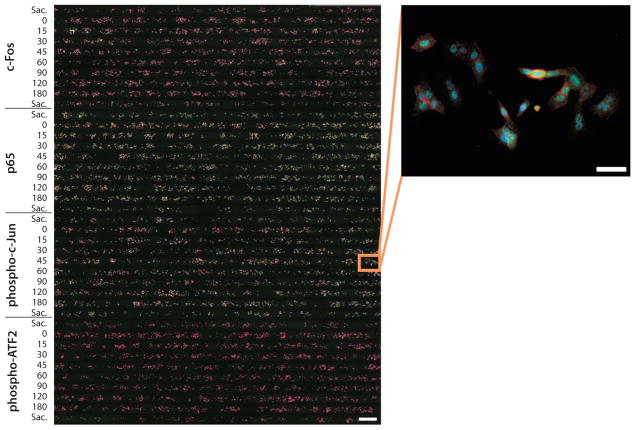
Fig. 7.
Example image data obtained from the microfluidic device. (A) Composite fluorescent image of an immunostained device (left, scale bar 500 μm) and enlarged view of cells in one chamber (right, scale bar 50 μm). Each row is a chamber, and each colored spot is an A549 lung cancer cell. Cells were stimulated with 10 ng/mL TNF for the indicated times. Sacrificial chambers are denoted “Sac.” Actin (phalloidin) is shown in red, signaling proteins (c-Fos, p65, phosphorylated c-Jun, and phospho-ATF2 in groups A, B, C, and D respectively) are shown in green, and nuclei (Hoechst 33258) are shown in blue.

