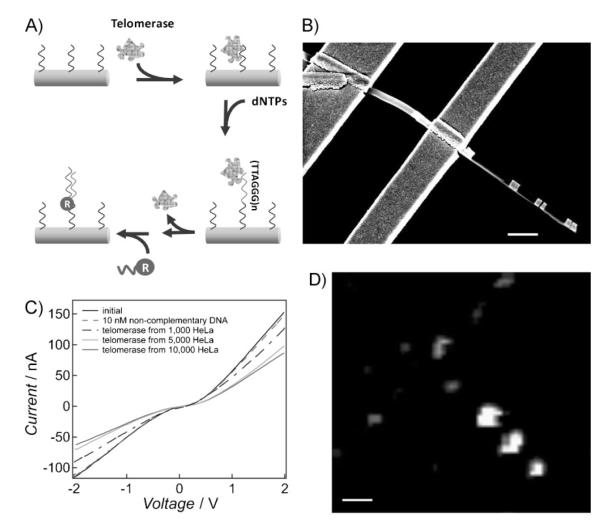
Figure 2.
A) Schematic of telomerase binding and elongation on the Au nanostructure (both Au nanorod and Au disk pair) surface. The oligonucleotide sequence serving as the telomerase binding substrate is 5′ HS T5 AAT CCG TCG AGC AGA GTT 3′. B) An SEM image of a representative device for both electrical and optical detection (C and D). Scale bar = 1 μm. C) Current versus voltage plots of the Au–PPy nanorod segment with binding of telomerase extracted from solutions of HeLa cells at different concentrations. D) As canning Raman microscope image of the same device in (C) showing the Cy5 signal upon binding of the oligonucleotide reporter strands. Scale bar = 1 μm.

