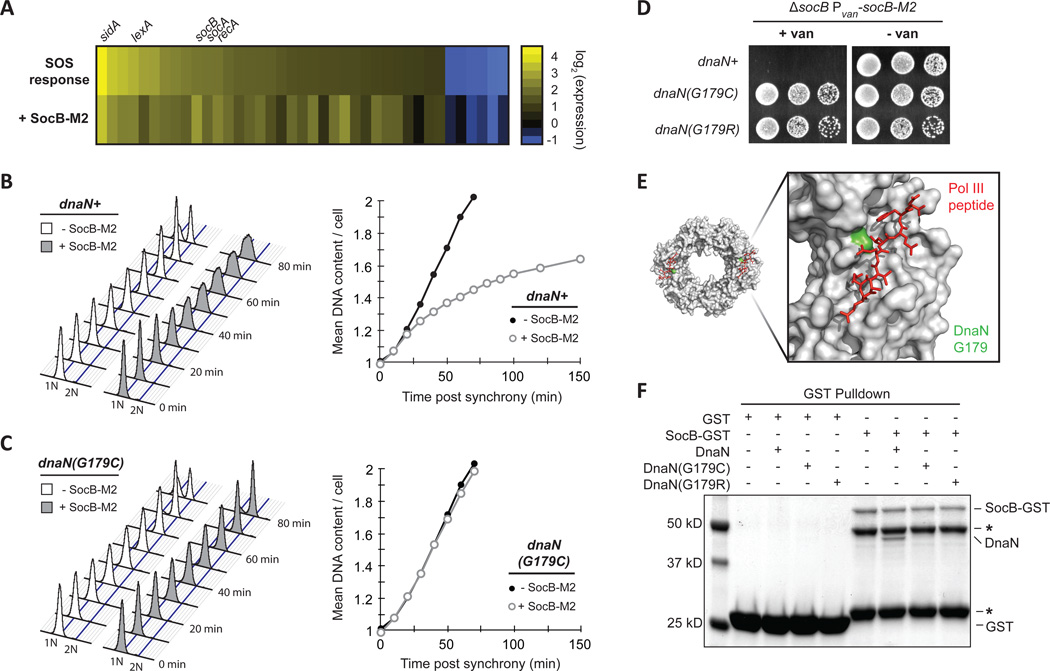
Fig. 3. SocB Blocks Replication Elongation Through an Interaction with DnaN.
(A) Analysis of gene expression changes following exposure to the DNA-damaging agent mitomycin C for 30 min (SOS response, top row) or following socB-M2 expression for 2 hr (+SocB-M2, bottom row). For each treatment, the genes induced or repressed more than 2-fold following mitomycin C treatment are shown.
(B) Flow cytometry of DNA content from synchronized cells grown ± socB-M2 expression. For the +SocB-M2 condition, socB-M2 was induced for 90 min prior to synchrony and release. Quantification of DNA content is shown on right.
(C) Same as (B), except performed with the dnaN(G179C) strain.
(D) Growth of indicated strains on socB-M2 inducing or repressing medium. Five-fold serial dilutions are shown.
(E) Structure of the E. coli sliding clamp in complex with a peptide derived from Pol III (PDB: 3D1F). Pol III peptide is in red, and the E. coli residue that corresponds to G179 in Caulobacter is colored in green.
(F) Interaction between SocB-GST and DnaN. For each condition, the indicated proteins were mixed with glutathione sepharose beads, washed, eluted, and then loaded on an SDS-PAGE gel. SocB-GST protein is unstable; asterisks indicate truncated SocB-GST products that retain GST tag.
See also Fig. S3.

