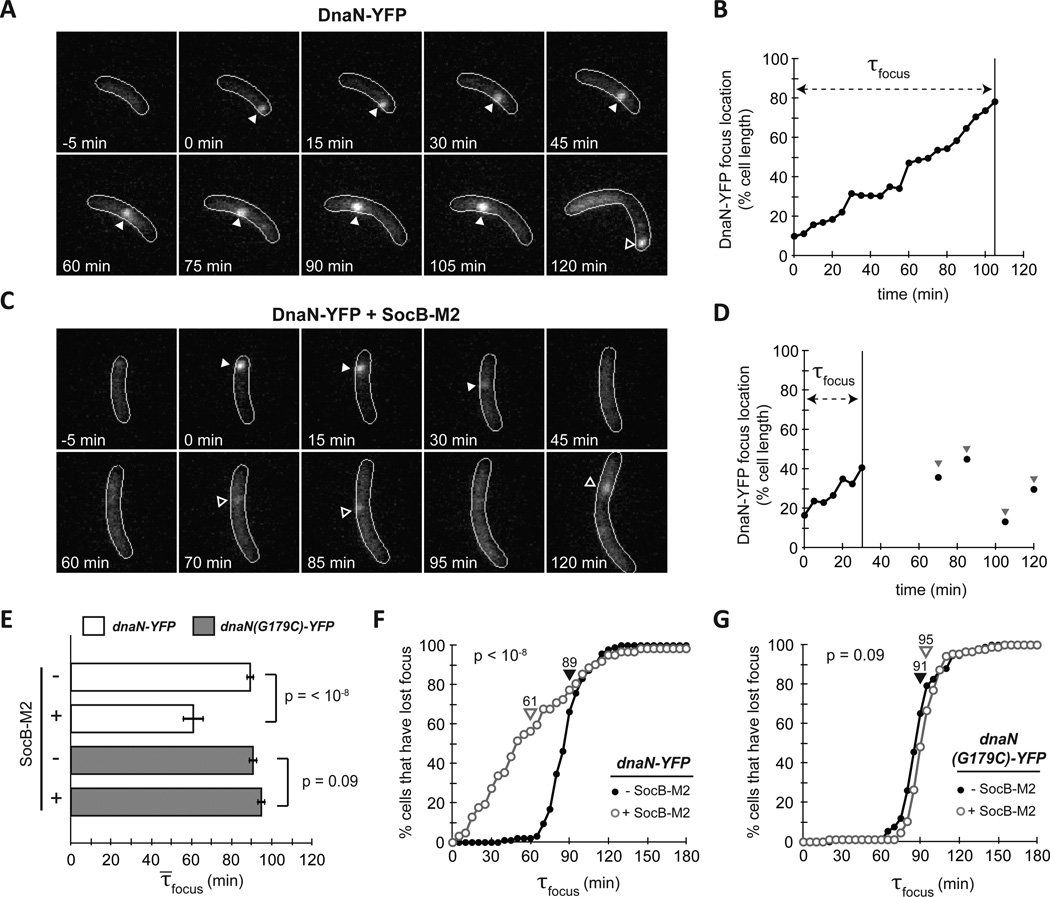
Fig. 4. SocB Induces Replication Fork Collapse.
(A) Fluorescence microscopy of strain bearing dnaN-YFP on a low-copy plasmid. dnaN-YFP was pre-induced for 2 h, and cells were synchronized and imaged every 5 min. Filled arrows indicates calculated position of DnaN-YFP focus; hollow arrows indicate a new round of replication following division.
(B) Calculated DnaN-YFP focus position of the cell from (A). τfocus is calculated as the time from focus formation to loss.
(C–D) Same as (A–B), except socB-M2 expression was induced for 90 min prior to synchrony and following release. Note the pre-mature focus loss between 30 and 45 min. Hollow arrows indicate transient DnaN-YFP focus formation events that may be attempts at replication restart.
(E) Average τ̄focus for dnaN-YFP strain (white bars) and dnaN(G179C)-YFP strain (grey bars) ± socB-M2 expression. Error bars indicate ± S.E.M; n≥60 cells per condition.
(F) Percentage of cells that have lost their DnaN-YFP focus as a function of time post initiation in the absence (filled circles) or presence (hollow circles) of socB-M2 expression. Average τ̄focus denoted by arrows. n≥60 cells per condition.
(G) Same as (F), but with dnaN(G179C)-YFP strain. n≥60 cells per condition.

