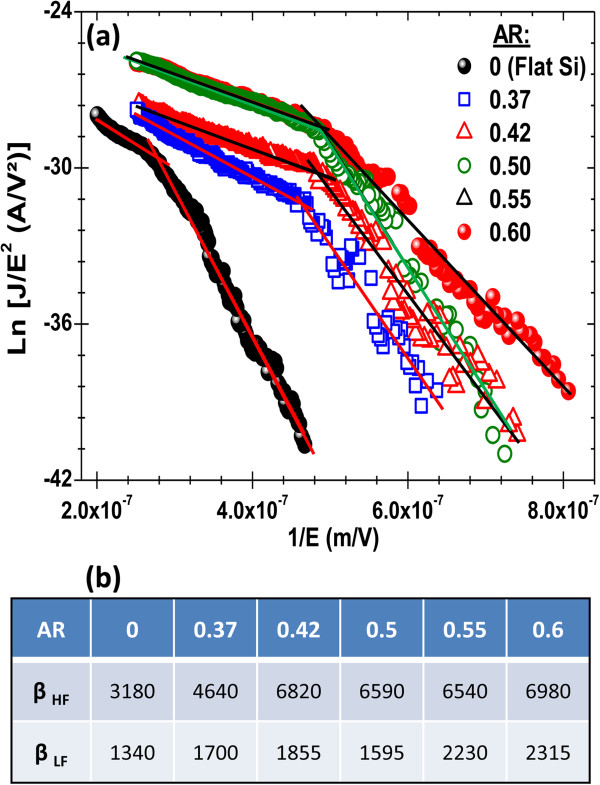
Figure 3.
Fowler-Nordheim analysis of the J-E curves of the hierarchal MWCNT cathodes. (a) Fowler-Nordheim plots for the h-MWCNT cathodes for the various AR values ranging from 0 to 0.6. (b) The table summarizes the deduced high-field (HF) and low-field (LF) enhancement factors (β) as a function of the AR of the Si pyramids.

