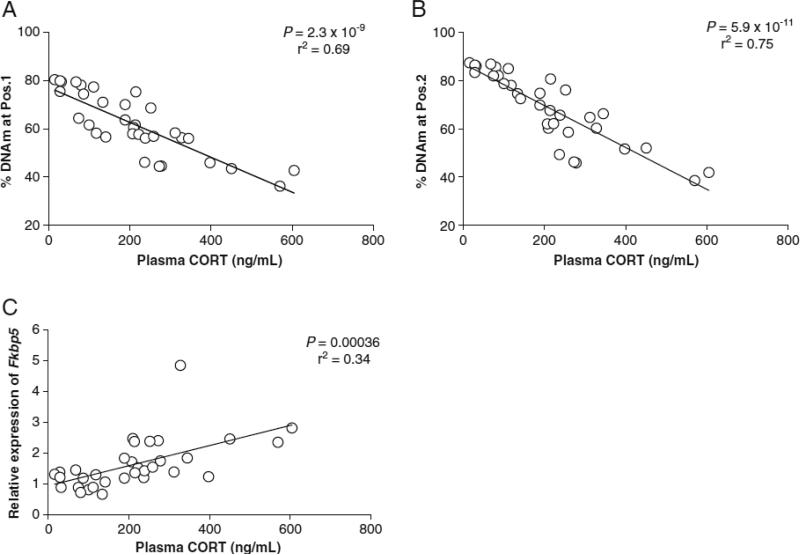
Fig. 2.
Regression analysis of mean corticosterone levels vs. methylation and expression. A strong correlation was observed between week-4-blood DNAm of Fkbp5 intron 1, CpG position 1 (a) and CpG position 2 (b) vs. mean corticosterone levels from weeks 1–4. c A more modest correlation was observed between expression of Fkbp5 and mean corticosterone levels

