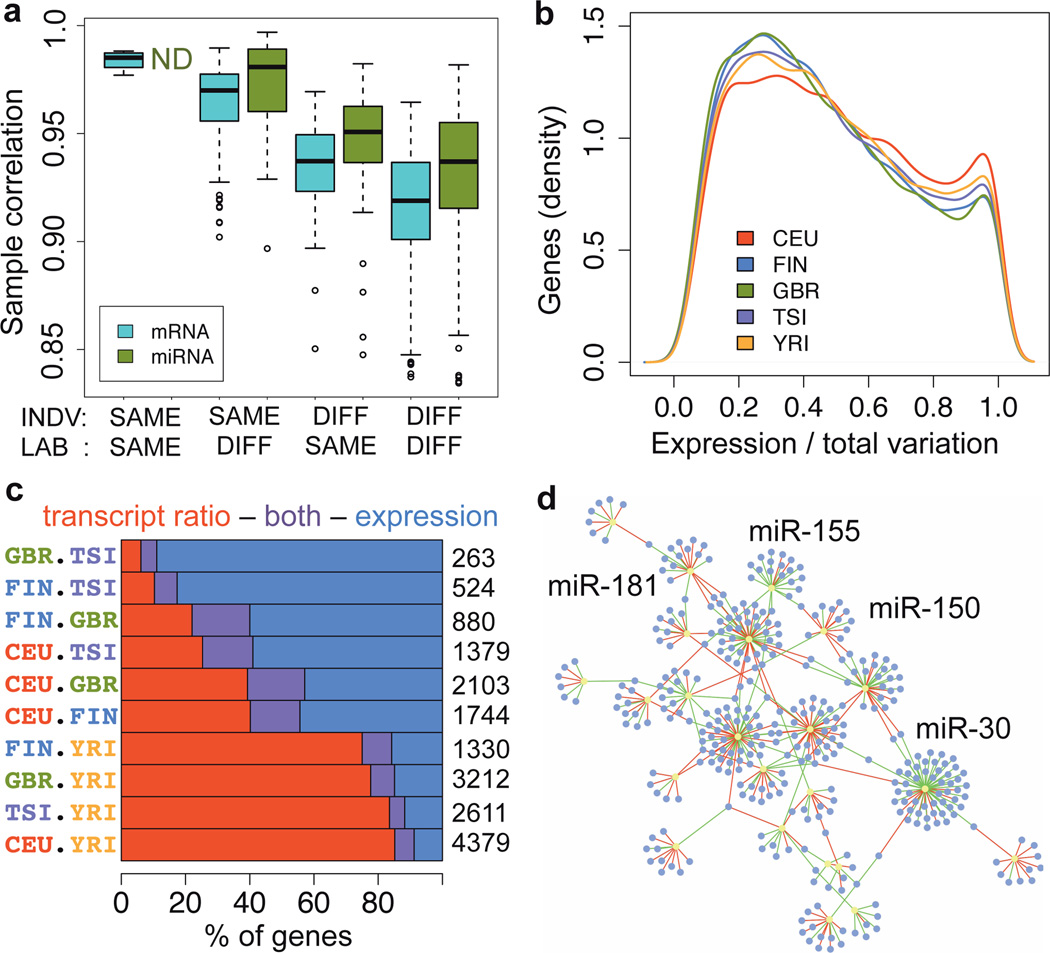
Figure 1. Transcriptome variation.
a) Spearman rank correlation of replicate samples, based on mRNA exon and miRNA quantifications of 5 individuals sequenced 8 and 7 times for mRNA and miRNA, respectively, and separated by the individual or the sequencing lab being the same or different. The quantifications have been normalized only for the total number of mapped reads (see Fig. S11 for correlations after normalization). b) The proportion of expression level variation (as opposed to splicing) of the total transcription variation between individuals in each population, measured per gene. c) Proportion of genes with differential expression levels and/or transcript usage between population pairs, out of the total listed on the right-hand side. d) Network of significant miRNA families (P<0.001; yellow) and their significantly associated mRNA targets (P<0.05; purple). The edges display negative (green) and positive (red) associations.

