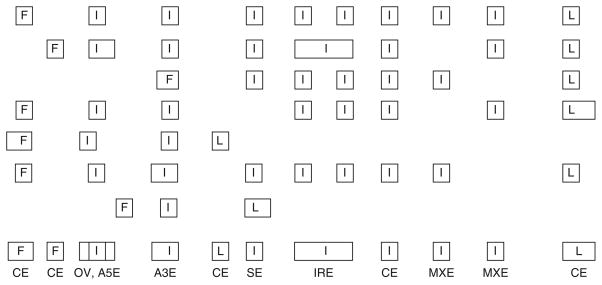
Fig. 1.
Cartoon depicting construction of an aggregate gene model. Exons are depicted as boxes labeled as internal (I), first (F), or last (L). Region classifications are listed at the bottom of the schematic. Classifications of splicing were defined as follows: overlap (OV), skipped exons (SE), alternative 5′/3′ exons (A5E/3E), constitutive exons (CE), mutually skipped exons (MXE), and intron retentions (IRE).

