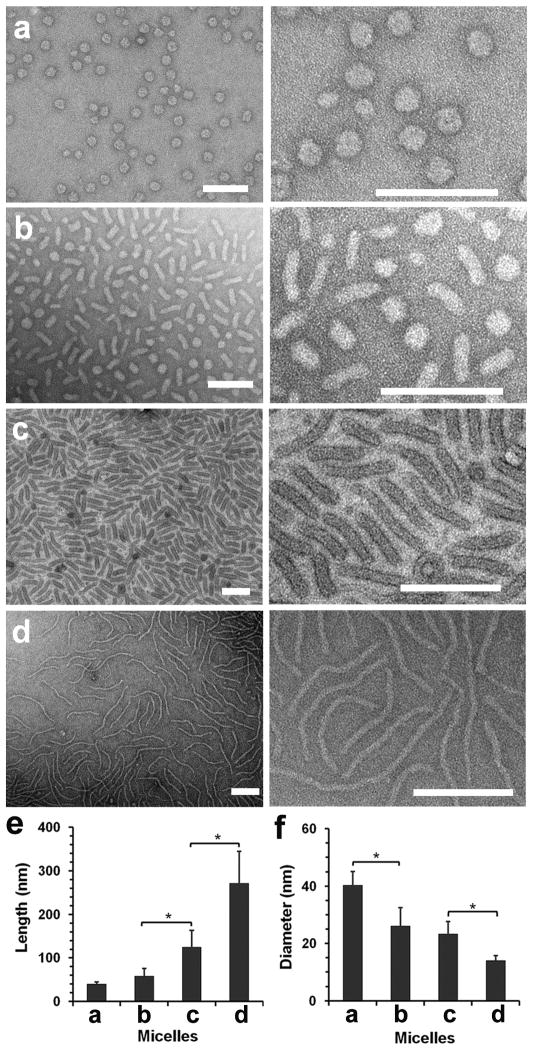
Figure 3.
Morphological transition of PEG-b-PPA/DNA micelles induced by increasing solvent polarity. (a–d) TEM images of transformed micelles obtained in 6:4 (v/v) (a), 5:5 (b), 3:7 (c), and 1:9 DMF–water mixture (d). (e and f) Average lengths and diameters of transformed micelles prepared at different DMF fractions as shown in panels (a–d). Plot shows mean ± standard deviation (n > 100, *p < 0.01; Student’s t-test).

