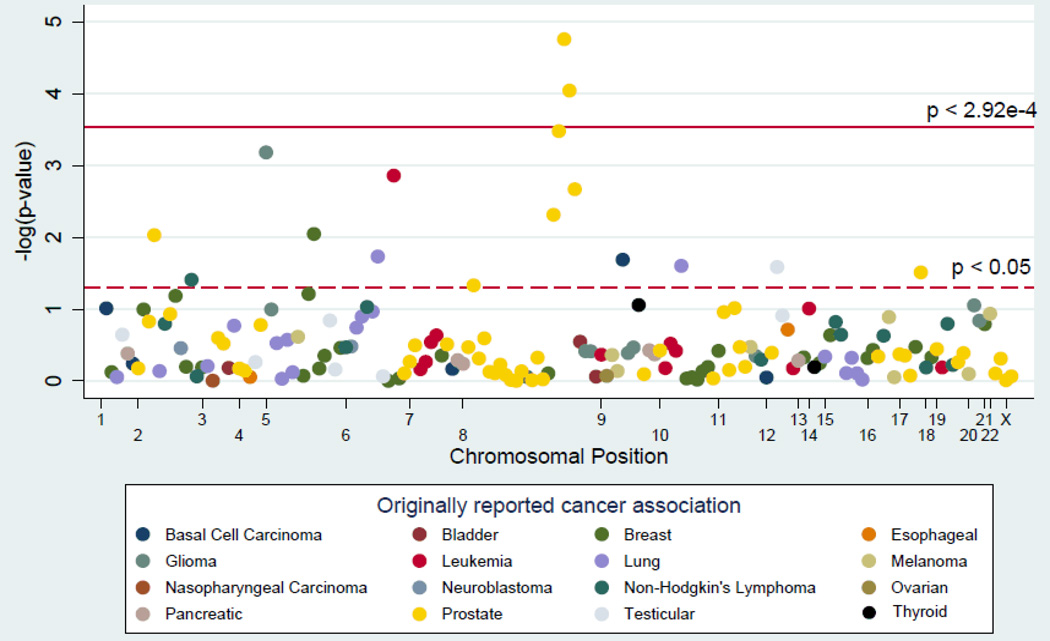
Figure 1. Manhattan plot of the meta-analysis association between risk variants of 18 other cancers and colorectal cancer.
The solid line is the Bonferroni-corrected significance threshold. Each association is colored according to the cancer for which the SNP was originally reported, and positioned on the x-axis according to its genomic position.

