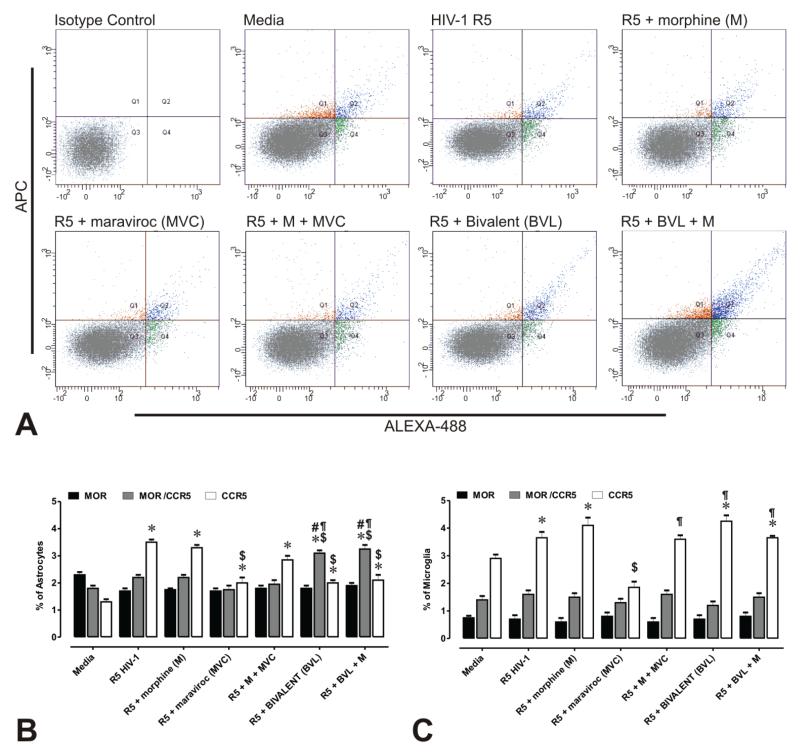
Figure 3. Flow cytometric analysis of CCR5 and MOR immunofluorescence in primary human glia.
(A) Scatterplots of CCR5 (Alexa 488-green) and MOR (APC-red) immunofluorescence intensity associated with astrocytes ± R5 HIV-1 and/or drug treatments. Auto-fluorescence was compensated by setting the detector voltage to the minimum level that discriminates between auto-fluorescence and specific immunofluorescence in both negative and positive controls. Isotype control antibodies were used to define settings in histogram plot analyses. Values in each histogram indicate the mean percentages ± SEM of CCR5 and/or MOR immunopositive astrocytes (B) or microglia (C). Differences in forward scatter and side scatter intensities suggest that CCR5 and MOR are not uniformly expressed by astroglia or microglia. Moreover, co-expression (as assessed by immunofluorescence) is only present in a small proportion of astrocytes and even a smaller percentage of microglia. Importantly, unlike astrocytes, a greater proportion of microglia possessed CCR5 immunoreactivity alone— suggesting heterodimer formation only occurs in a subset of CCR5+ microglia. Note the proportion of CCR5+ astrocytes increases while CCR5+ microglia increases in following exposure to the bivalent ligand—suggesting fundamental differences in the actions of the bivalent and regulation of CCR5 in each glial type. Approximately 20,000 events were analyzed per treatment condition in each experiment and size discrimination was used as a crude method for viability determination. Graphs represent the data obtained from three independent experiments (*p < 0.005 vs. un-infected cells; $p < 0.05 vs. R5 HIV-1; #p <0.05 vs. R5 + morphine (M); ¶p < 0.05 vs. R5 + maraviroc (MVC); §p < 0.05 vs. R5 + M + MCV).

