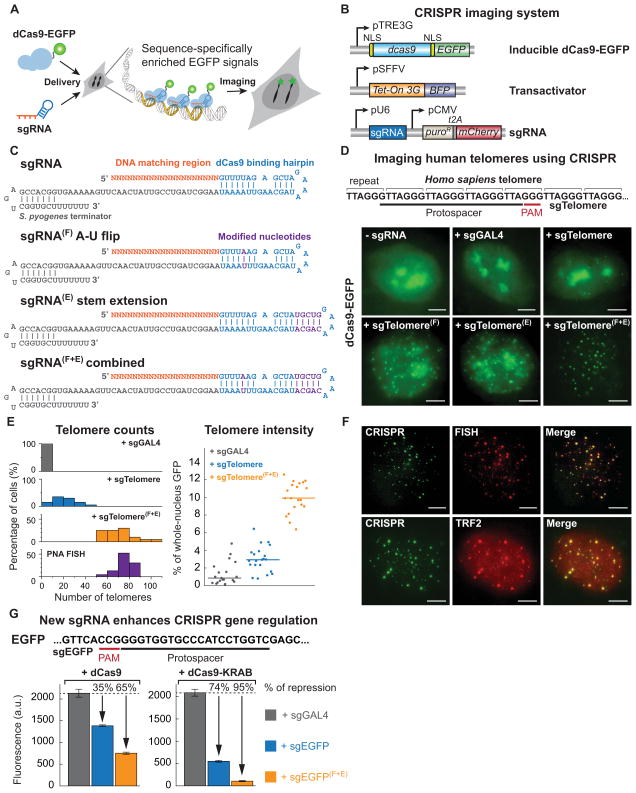
Figure 1. An optimized CRISPR/Cas system for visualizing genomic sequences in living mammalian cells.
(A) Overview of CRISPR imaging. Sequence-specific enrichment of fluorescence signals by sgRNA-directed dCas9-EGFP allows the imaging of genomic elements in living cells. (B) The three components of the CRISPR imaging: a doxycycline-inducible dCas9-EGFP fusion protein, a Tet-on 3G transactivator, and target-specific sgRNAs expressed from a murine U6 promoter. (C) Optimized sgRNA designs. sgRNA(F), A-U pair flip; sgRNA(E), a 5-bp extension of the hairpin; sgRNA(F+E), combination of both modifications. Target basepairing region (orange), dCas9 binding hairpin (blue), the S. pyogenes-derived terminator (grey), and nucleotide modifications (purple) are shown. (D) CRISPR imaging of human telomeres in RPE cells using different sgRNA designs. The sgRNA target sequence (black line) and the PAM (red line) are shown. sgGAL4 is used as the negative control. (E) Histograms of telomere counts and telomere intensity (measured as % of whole-nucleus GFP) in single cell using sgTelomere and sgTelomere(F+E). The telomere number detected by PNA FISH is also shown. n = 20. (F) Colabeling of telomeres using dCas9-EGFP (green) & PNA FISH (top, red), or dCas9-EGFP & antibody to TRF2 (bottom, red). (G) Optimized sgRNA design improves gene regulation efficiency using dCas9 alone (left) or dCas9-KRAB fusion protein (right). The target sequence (black line) and the PAM (red line) are shown. The data are displayed as mean ± standard deviation for 3 independent experiments. All scale bars: 5 μm. See also Figure S1.

