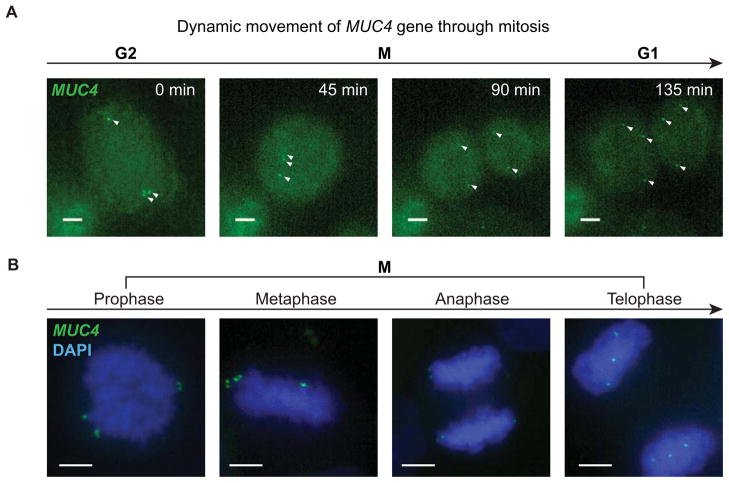
Figure 7. Dynamics of the MUC4 loci through mitosis.
(A) Snapshots from a MUC4 image sequence in which a HeLa cell undergoes mitosis, showing z maximum projections of 4 μm depth. The arrows indicate the MUC4 loci, which are not completely captured during mitosis because the cell thickness exceeds the z range. See Movie S5. (B) CRISPR labeled HeLa cells fixed and stained with DAPI (blue) to image the relationship between MUC4 loci (green) and the chromosomes. Cells at different stages of mitosis are displayed, showing z maximum projections of 18 μm. Scale bars: 5 μm. See also Movie S5.

