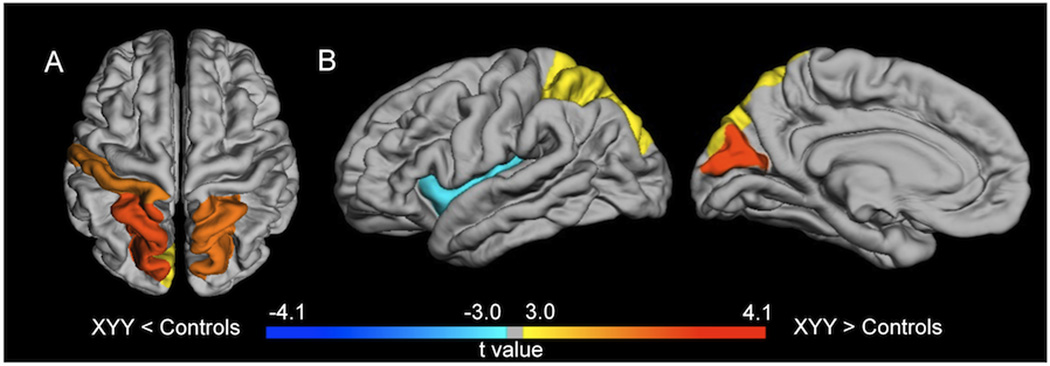
Figure 2.
Regions showing significant differences at a whole brain level (FDR corrected) between groups regarding (A) white matter volume and (B) surface area. Cold colors show regions of reduced WMV/surface area in boys with XYY compared to controls (XY), while warm colors show regions of increased WMV/surface in XYY compared to controls. Color bar shows t value.

